 CloudConsole
CloudWatch alarm: Kinesis PutRecords.FailedRecords
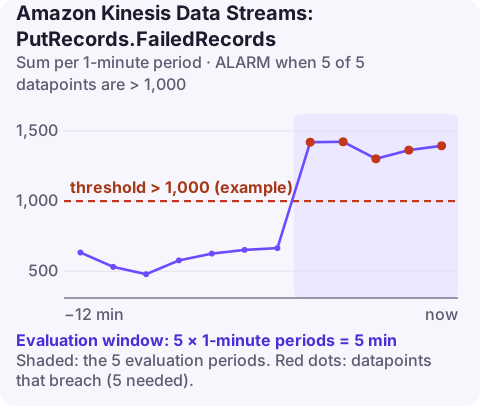
Alarm on AWS/Kinesis PutRecords.FailedRecords per StreamName using the Sum over 60 seconds, firing when it is above your chosen count for 5 of 5 minutes. PutRecords can succeed as a call while individual records inside the batch fail, so this metric is how you see the records your producers must retry.
Why batch failures need their own alarm
PutRecords sends up to 500 records per request. Kinesis processes each one independently: some succeed, some fail, and the call itself returns HTTP 200 either way. The response includes FailedRecordCount and, for each failed entry, an ErrorCode such as ProvisionedThroughputExceededException or InternalFailure. Records come back in the same order you sent them.
This is a common source of silent data loss. Producer code that checks only for an exception, not for FailedRecordCount > 0, drops every throttled record without logging anything. The PutRecords.FailedRecords metric is often the only place those losses show up.
A quick way to check a producer is to send a deliberately oversized burst to a test stream with one shard and confirm that your logs show the retried entries. If the test "succeeds" with nothing logged, the producer is ignoring partial failures.
Recommended alarm settings
| Setting | Recommended value |
|---|---|
| Namespace | AWS/Kinesis |
| Metric | PutRecords.FailedRecords |
| Dimensions | StreamName |
| Statistic | Sum |
| Threshold | Depends on your situation |
| Period | 60 seconds |
| Datapoints to alarm | 5 |
| Evaluation periods | 5 |
| Comparison operator | GreaterThanThreshold |
How to choose the threshold
- Know your producers. If they correctly retry failed entries (the KPL does; hand-written SDK code often does not), a modest failure count only means delay.
- Use two weeks of history. Chart the Sum per minute and the matching
PutRecords.TotalRecords, and look at the failure count during normal peaks. - Express it as a rate first, then convert: if peak traffic is 200,000 records a minute and you accept 0.5% failing before retry, the threshold is 1,000.
- Prefer metric math when traffic varies a lot. An alarm on FailedRecords divided by TotalRecords stays meaningful at night and at peak, which a fixed count does not.
Create the alarm
aws cloudwatch put-metric-alarm \
  --alarm-name kinesis-telemetry-putrecords-failed \
  --alarm-description "More than 1000 PutRecords entries failing per minute on telemetry" \
  --namespace AWS/Kinesis \
  --metric-name PutRecords.FailedRecords \
  --dimensions Name=StreamName,Value=telemetry \
  --statistic Sum \
  --period 60 \
  --evaluation-periods 5 \
  --datapoints-to-alarm 5 \
  --threshold 1000 \
  --comparison-operator GreaterThanThreshold \
  --alarm-actions arn:aws:sns:eu-west-2:123456789012:oncall-alerts
1,000 is an example derived from the method above.
When it fires
- Check producer behaviour. Search producer logs for
FailedRecordCounthandling; if you find none, records are being lost, not just delayed. - Classify the errors. Throttling errors point to capacity or a hot shard;
InternalFailureis rarer and usually transient, so retry. - Retry only the failed entries, with exponential backoff, by matching response positions back to the request.
- Spread or add capacity: use high-cardinality partition keys, add shards, or switch to on-demand mode. Smoothing producer bursts (smaller, more frequent batches) also helps.
Questions
Does a successful PutRecords call mean all records were written?
No. Always check FailedRecordCount in the response and resend the entries that have an ErrorCode.
Should the threshold be zero?
Only if producers never retry. With correct retries, brief non-zero values during traffic spikes are expected and a zero threshold would be noisy.
Partial batch failures are invisible in application error rates, which makes this alarm the one that tells you data is going missing. CloudConsole, an AWS phone app, is built to bring alarms like this to your phone with the metric history attached.
Did it start after a deploy? What changed? on the app’s alarm screen lists the deploys and configuration changes from the hour before the alarm fired.
About the app → · Download on the App Store