 CloudConsole
CloudWatch alarm: NAT Gateway ErrorPortAllocation
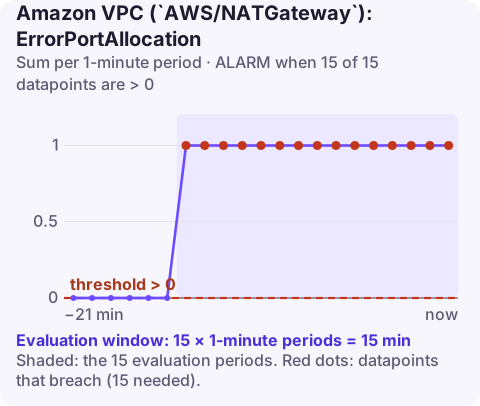
Alarm on AWS/NATGateway ErrorPortAllocation per NatGatewayId using the Sum over 60 seconds, firing when it is above 0 for 15 of 15 minutes. A non-zero count means the NAT gateway ran out of source ports for a destination, so new outbound connections from your private subnets to that destination are failing.
What port allocation errors are
A NAT gateway rewrites the source address of outbound connections to its own IP and picks a source port. For each of its IP addresses it can hold up to 55,000 simultaneous connections to each unique destination (destination IP, port and protocol). When that pool is used up, new connections to that destination fail and ErrorPortAllocation counts them.
The limit is per destination, so total traffic does not matter much. What triggers it is many connections to one busy endpoint: a third-party API, a single public IP of a SaaS service, or an AWS API endpoint reached through the internet. Applications that open a new connection per request instead of reusing them, and many short-lived Lambda functions or containers calling the same API, are the usual sources.
On the client side it looks like connection timeouts or "connection refused"-style errors to one destination while others work fine.
Recommended alarm settings
| Setting | Recommended value |
|---|---|
| Namespace | AWS/NATGateway |
| Metric | ErrorPortAllocation |
| Dimensions | NatGatewayId |
| Statistic | Sum |
| Threshold | 0.0 |
| Period | 60 seconds |
| Datapoints to alarm | 15 |
| Evaluation periods | 15 |
| Comparison operator | GreaterThanThreshold |
Why these settings
Any port allocation error is a failed connection, so the threshold is zero. The 15-of-15 window means the alarm waits for a sustained pattern rather than a single spike during a deploy, when many tasks start and connect at once. If you call a critical dependency through this gateway, shorten the window so you hear about it in minutes. Treat missing data as not breaching; the metric reports zero or nothing when there are no errors.
Create the alarm
aws cloudwatch put-metric-alarm \
  --alarm-name natgw-port-allocation-errors \
  --alarm-description "NAT gateway cannot allocate source ports" \
  --namespace AWS/NATGateway \
  --metric-name ErrorPortAllocation \
  --dimensions Name=NatGatewayId,Value=nat-0123456789abcdef0 \
  --statistic Sum \
  --period 60 \
  --evaluation-periods 15 \
  --datapoints-to-alarm 15 \
  --threshold 0 \
  --comparison-operator GreaterThanThreshold \
  --treat-missing-data notBreaching \
  --alarm-actions arn:aws:sns:eu-west-2:123456789012:oncall-alerts
When it fires
- Confirm the load: graph
ActiveConnectionCountandConnectionAttemptCountfor the gateway; a sharp rise in attempts with flat traffic suggests connection churn. - Find the destination. VPC Flow Logs on the NAT gateway's network interface, queried with Logs Insights, show which destination address dominates.
- Reuse connections: enable HTTP keep-alive and connection pooling, and initialise clients outside the Lambda handler so warm invocations reuse them.
- Take AWS traffic off the NAT: gateway endpoints for S3 and DynamoDB, and interface endpoints for other services, remove that traffic entirely.
- Add capacity: associate secondary IP addresses with the NAT gateway (each adds another pool of ports per destination) or spread subnets across more NAT gateways.
Questions
What causes ErrorPortAllocation on a NAT gateway?
Too many simultaneous connections from your VPC to the same destination IP, port and protocol, beyond what the gateway's IP addresses can map.
Does adding a NAT gateway Elastic IP help?
Yes. Each additional IP address associated with the NAT gateway provides another set of source ports per destination.
Port exhaustion shows up as one external dependency failing while everything else works, which is confusing to triage on the move. CloudConsole, a phone app for AWS, is built to show this alarm and the gateway's connection metrics on your phone.
Did it start after a deploy? What changed? on the app’s alarm screen lists the deploys and configuration changes from the hour before the alarm fired.
About the app → · Download on the App Store