 CloudConsole
CloudWatch alarm: Amazon S3 5xxErrors
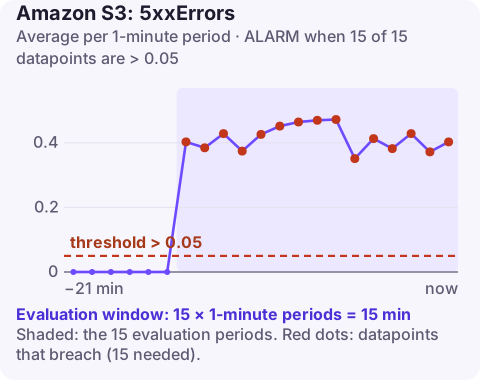
Alarm on AWS/S3 5xxErrors for a bucket's BucketName and FilterId, Average over 60 seconds, firing when it is above 0.05 for 15 consecutive minutes. That means more than 5% of requests are failing on the server side for a quarter of an hour, which is almost always 503 SlowDown from exceeding request rates, or occasionally a service issue.
What the metric measures
Like the other S3 request metrics, 5xxErrors records 1 per request that returned a 5xx status and 0 for the rest, so its Average is a server error rate. It needs a request metrics configuration on the bucket; the configuration ID is the FilterId.
In practice, two codes account for nearly all 5xx responses:
- 503 SlowDown: S3 supports at least 3,500 PUT/COPY/POST/DELETE and 5,500 GET/HEAD requests per second per partitioned prefix, and scales up gradually as load grows. A sudden burst onto a single prefix can exceed what is available and get throttled. See SlowDown.
- 500 InternalError: occasional transient failures inside S3; clients are expected to retry them.
AWS SDKs retry both automatically, so a small 5xx rate often causes no visible failures. A 5% rate for fifteen minutes does.
Recommended alarm settings
| Setting | Recommended value |
|---|---|
| Namespace | AWS/S3 |
| Metric | 5xxErrors |
| Dimensions | BucketName, FilterId |
| Statistic | Average |
| Threshold | 0.05 |
| Period | 60 seconds |
| Datapoints to alarm | 15 |
| Evaluation periods | 15 |
| Comparison operator | GreaterThanThreshold |
Request metrics are not on by default. They are billed as custom CloudWatch metrics and need a metrics configuration on the bucket; the configuration's ID becomes the FilterId dimension:
aws s3api put-bucket-metrics-configuration \
  --bucket my-bucket \
  --id EntireBucket \
  --metrics-configuration Id=EntireBucket
Tuning
Most buckets run at or near zero 5xx. If yours has a known burst pattern (a nightly bulk upload that triggers SlowDown until S3 scales), prefer fixing the key layout over raising the threshold. For buckets behind user-facing paths, a lower threshold such as 0.01 catches problems earlier; keep the 15-minute window to avoid paging on brief retries.
Create the alarm
aws cloudwatch put-metric-alarm \
  --alarm-name s3-my-bucket-5xx-rate \
  --alarm-description "More than 5% of requests to my-bucket returning 5xx for 15 minutes" \
  --namespace AWS/S3 \
  --metric-name 5xxErrors \
  --dimensions Name=BucketName,Value=my-bucket Name=FilterId,Value=EntireBucket \
  --statistic Average \
  --period 60 \
  --evaluation-periods 15 \
  --datapoints-to-alarm 15 \
  --threshold 0.05 \
  --comparison-operator GreaterThanThreshold \
  --treat-missing-data notBreaching \
  --alarm-actions arn:aws:sns:eu-west-2:123456789012:oncall-alerts
When it fires
- Is it SlowDown? Server access logs show the error code. If most are
SlowDown, look at which prefixes are hot. - Spread the load: distribute objects across more prefixes, and make clients back off with jitter instead of retrying immediately.
- Reduce request count: cache hot objects with CloudFront, batch small objects into larger ones, avoid listing the bucket in a tight loop.
- Check AWS Health for S3 issues in the Region if errors are 500s across many prefixes and clients.
Questions
How do I create a CloudWatch alarm for an S3 bucket?
Enable request metrics on the bucket with a metrics configuration (a filter), then alarm on metrics such as 4xxErrors or 5xxErrors using the BucketName and FilterId dimensions. Daily storage metrics like BucketSizeBytes need no setup but are only updated once a day.
Do S3 5xx errors mean S3 is down?
Rarely. Most 5xx responses are 503 SlowDown from request rates on a prefix; true service issues show up as 500s across many buckets and are reported in AWS Health.
S3 server errors usually come in bursts tied to a job or a traffic peak. CloudConsole, a phone app for AWS, is built to show the alarm and its timeline on your phone so you can see what it lines up with.
Did it start after a deploy? What changed? on the app’s alarm screen lists the deploys and configuration changes from the hour before the alarm fired.
About the app → · Download on the App Store