 CloudConsole
aws logs put-metric-filter
aws logs put-metric-filter turns matching log events into a CloudWatch metric, for example counting lines that contain ERROR. Pass --metric-transformations with a metric name, namespace and value (1 to count, or $.field to extract a number), set defaultValue=0 so quiet periods report zero, then alarm on the metric.
What the command does
A metric filter watches events as they are ingested into a log group. Each matching event publishes a value to the custom metric you name. It is the quickest way to alarm on something that only exists in logs: application errors, payment failures, a specific exception, or a latency field in structured logs.
Filters only see new events. Creating one today does not backfill metrics from yesterday's logs.
Syntax
aws logs put-metric-filter \
  --log-group-name /ecs/orders-api \
  --filter-name orders-errors \
  --filter-pattern '<pattern>' \
  --metric-transformations \
    metricName=OrdersErrors,metricNamespace=MyApp,metricValue=1,defaultValue=0
Running it again with the same --filter-name replaces that filter.
Worked examples
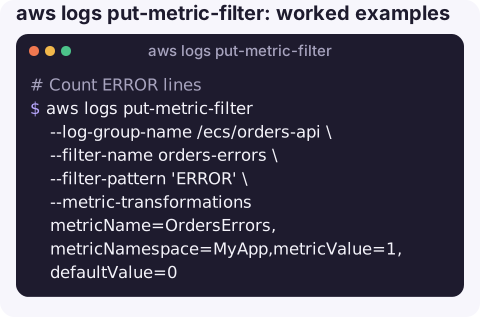
Count ERROR lines:
aws logs put-metric-filter --log-group-name /ecs/orders-api \
  --filter-name orders-errors \
  --filter-pattern 'ERROR' \
  --metric-transformations metricName=OrdersErrors,metricNamespace=MyApp,metricValue=1,defaultValue=0
Extract a number from JSON logs, such as request latency, and record its unit:
aws logs put-metric-filter --log-group-name /ecs/orders-api \
  --filter-name orders-latency \
  --filter-pattern '{ $.latencyMs = * }' \
  --metric-transformations metricName=OrderLatency,metricNamespace=MyApp,metricValue='$.latencyMs',unit=Milliseconds
Test a pattern before creating it, against sample lines:
aws logs test-metric-filter --filter-pattern '{ $.level = "error" }' \
  --log-event-messages '{"level":"error","msg":"card declined"}' '{"level":"info","msg":"ok"}'
Alarm when there are more than five errors in five minutes:
aws cloudwatch put-metric-alarm --alarm-name orders-api-errors \
  --namespace MyApp --metric-name OrdersErrors \
  --statistic Sum --period 300 --evaluation-periods 1 \
  --threshold 5 --comparison-operator GreaterThanThreshold \
  --treat-missing-data notBreaching \
  --alarm-actions arn:aws:sns:eu-west-2:123456789012:oncall
List filters on a group:
aws logs describe-metric-filters --log-group-name /ecs/orders-api \
  --query "metricFilters[].[filterName,filterPattern,metricTransformations[0].metricName]" --output table
Metric transformation fields
| Field | Notes |
|---|---|
metricName, metricNamespace | Where the metric appears in CloudWatch. Use your own namespace, not one starting with AWS/. |
metricValue | 1 to count, or a selector such as $.latencyMs to publish a value from the event. |
defaultValue | Published when nothing matches in a period. 0 makes graphs and alarms continuous. |
unit | Optional; set it so statistics are labelled correctly. |
dimensions | Up to a small number of JSON-field dimensions; cannot be combined with defaultValue. Watch the cost of high-cardinality values. |
Gotchas
- Metric appears only after the first match (or the first default value). An empty
list-metricsstraight after creation is normal. - Quoting. In shells, wrap patterns in single quotes; JSON selectors like
$.latencyMsalso need single quotes so the shell does not treat$as a variable. - Case and exact terms.
ERRORdoes not matcherror; test with real samples. - Each custom metric is billed. Dimensions multiply the number of metrics.
- Deleting the log group deletes the filter, and any alarm on the metric quietly stops receiving data.
Questions
How do I create a CloudWatch alarm on a log pattern?
Create a metric filter with put-metric-filter, then create an alarm on that metric with aws cloudwatch put-metric-alarm using the Sum statistic.
Why is my metric filter not producing data?
Filters only see events ingested after they are created, and patterns are case-sensitive. Test the pattern with test-metric-filter against real log lines.
What is the difference between a metric filter and a subscription filter?
A metric filter turns matches into numbers in CloudWatch metrics. A subscription filter streams the matching events themselves to Lambda, Kinesis or Firehose.
An alarm built from a log pattern is often the first thing that reaches your phone when an app misbehaves. CloudConsole, a phone app for AWS, is built to show that alarm with the log lines that triggered it.
About the app → · Download on the App Store