 CloudConsole
Count errors over time with CloudWatch Logs Insights
Filter to error events, then aggregate with stats count(*) by bin(5m) to get an error count per five-minute bucket that the console can chart. Swap the bin for a field, such as the log group or an error code, to see where the errors come from, and sort by the count to put the worst offenders first.
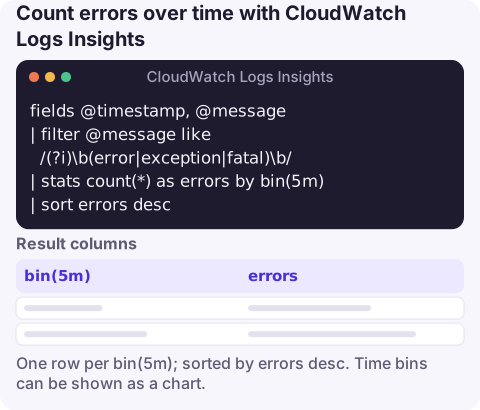
The query
fields @timestamp, @message
| filter @message like /(?i)\b(error|exception|fatal)\b/
| stats count(*) as errors by bin(5m)
| sort errors desc
Run it over the incident window, then open the Visualization tab to see the same numbers as a line chart. Remove the sort line if you want the table in time order.
How it works, line by line
fields @timestamp, @messagelimits the columns carried through the pipeline. It's optional here but makes the intent clear and keeps intermediate results light.filter @message like /…/keeps only events whose text matches the regex.(?i)makes it case-insensitive and\bstopserrorfrom matching inside words such aserrorHandler. If your logs are JSON with a level field,filter level = "ERROR"is faster and more precise.stats count(*) as errors by bin(5m)groups matching events into five-minute buckets aligned to the clock and counts each. Pick a bin about 1/50th to 1/200th of the time range so the chart has enough points without being noisy.sort errors descsorts by the alias you named, putting the worst buckets first.
Variations
Group by count per source: which log group or stream is producing errors.
filter level = "ERROR"
| stats count(*) as errors by @log
| sort errors desc
Error rate rather than volume. strcontains returns 1 or 0, so summing it counts matching events:
stats count(*) as total,
      sum(strcontains(@message, "ERROR")) as errors,
      sum(strcontains(@message, "ERROR")) * 100 / count(*) as errorPct
  by bin(5m)
Count unique things affected. count_distinct gives the number of different users or requests that hit an error, which matters more than raw volume when one client retries in a loop:
filter level = "ERROR"
| stats count(*) as errors, count_distinct(userId) as usersAffected by bin(15m)
Top error types, extracting the exception class from text logs:
filter @message like /Exception/
| parse @message /(?<exception>[A-Za-z.]+Exception)/
| stats count(*) as n by exception
| sort n desc
| limit 10
Across accounts
If your organisation uses CloudWatch cross-account observability, a monitoring account can select log groups from linked source accounts in the Logs Insights log-group selector and run the same query across them. Group by @log to see the account and log group of each count, since @log includes the account ID. Without that set-up, you need to run the query in each account separately, for example with a loop over CLI profiles and aws logs start-query.
Limits and cost
- You're billed for the GB scanned in the selected log groups and time range, regardless of how few errors match. A one-hour query over one log group costs far less than a 30-day query over twenty.
count_distinctis approximate for very high-cardinality fields; treat large values as estimates.- For a standing error count with alerting, a metric filter or embedded metrics is cheaper than re-running a query; Logs Insights is for investigation. See the Lambda Errors alarm for a metric-based approach.
Questions
How do I count by group in CloudWatch Logs Insights?
Use stats count(*) by fieldName, for example stats count(*) as n by status, then sort n desc to see the most frequent values first.
How do I count unique values in Logs Insights?
Use count_distinct(field), for example stats count_distinct(userId). For very high-cardinality fields the result is approximate.
Can Logs Insights query logs in other accounts?
Yes, from a monitoring account set up with CloudWatch cross-account observability. Otherwise, run the query in each account.
An error count is most useful in the first minutes of an incident. CloudConsole, a phone app for AWS, is built to show the alarm and the matching error lines together on your phone.
About the app → · Download on the App Store