 CloudConsole
How to find DynamoDB throttling
Check the CloudWatch metrics ReadThrottleEvents and WriteThrottleEvents (and ThrottledRequests per operation) for each table and each global secondary index; whichever is non-zero is throttled. Then turn on CloudWatch Contributor Insights for DynamoDB on that table to see the most-throttled partition keys. Throttling with spare table capacity almost always means a hot key or an under-provisioned GSI, not a table that's too small.
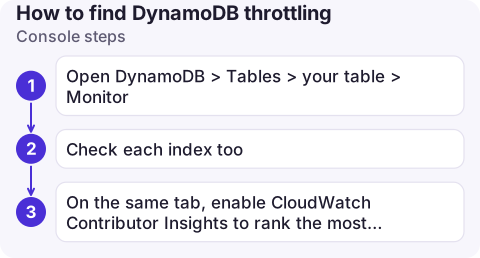
Console steps
- Open DynamoDB > Tables > your table > Monitor. The CloudWatch graphs include read and write throttled requests and events, and consumed versus provisioned capacity.
- Check each index too: GSI throttling is reported with the
GlobalSecondaryIndexNamedimension and, for writes, throttles the base table. - On the same tab, enable CloudWatch Contributor Insights to rank the most accessed and most throttled keys.
CLI steps
# Throttle events for a table over the last 3 hours
for m in ReadThrottleEvents WriteThrottleEvents; do
  aws cloudwatch get-metric-statistics --namespace AWS/DynamoDB --metric-name $m \
    --dimensions Name=TableName,Value=orders --statistics Sum --period 300 \
    --start-time $(date -u -d '-3 hours' +%FT%TZ) --end-time $(date -u +%FT%TZ) \
    --query "sum(Datapoints[].Sum)" --output text | sed "s/^/$m: /"
done

# Same for a GSI
aws cloudwatch get-metric-statistics --namespace AWS/DynamoDB --metric-name WriteThrottleEvents \
  --dimensions Name=TableName,Value=orders Name=GlobalSecondaryIndexName,Value=status-index \
  --statistics Sum --period 300 \
  --start-time $(date -u -d '-3 hours' +%FT%TZ) --end-time $(date -u +%FT%TZ) \
  --query "sum(Datapoints[].Sum)"

# Turn on Contributor Insights (throttled keys only keeps it cheaper)
aws dynamodb update-contributor-insights --table-name orders \
  --contributor-insights-action ENABLE --contributor-insights-mode THROTTLED_KEYS
Interpret it
| Pattern | Likely cause | Fix |
|---|---|---|
| Consumed near provisioned, throttles on the table | Under-provisioned, or auto scaling too slow for a spike | Raise capacity or the auto scaling max; consider on-demand |
| Throttles while consumed capacity is well below provisioned | Hot partition: one key above the per-partition limit (about 3,000 RCU / 1,000 WCU) | Spread writes (key suffixes), cache hot reads, batch less aggressively |
| Base table write throttles with a GSI throttled | GSI can't keep up with writes | Give the GSI enough write capacity, or rethink its key |
| On-demand table throttled | Hot key, a sudden jump far above previous peak traffic, or a configured on-demand maximum throughput | Same as hot partition; pre-warm with warm throughput for planned events |
Common mistakes
- Only checking the table: GSI back-pressure is a frequent cause of write throttling.
- Using Average for throttle metrics. Use Sum.
- Raising capacity for a hot key: a single partition's limit doesn't grow with the table's capacity.
- Leaving Contributor Insights on everywhere: it's charged per event; enable it where you're investigating.
- SDK retries hide throttling from your app until they run out; then you see provisioned throughput exceeded errors.
Questions
How do I check if a DynamoDB table is throttled?
Look at the ReadThrottleEvents and WriteThrottleEvents metrics, with the Sum statistic, for the table and each GSI in CloudWatch or on the table's Monitor tab.
Can DynamoDB on-demand tables be throttled?
Yes. Hot partition keys, traffic far above the previous peak, or a configured maximum throughput can throttle on-demand tables.
How do I find the hot partition key in DynamoDB?
Enable CloudWatch Contributor Insights for DynamoDB on the table; it ranks the most accessed and most throttled keys.

DynamoDB throttling often appears as latency and retries upstream before anything errors. CloudConsole, a phone app for AWS, is being built to show throttle alarms and metrics on your phone, so you can tell which table is involved.
About the app → · Download on the App Store