 CloudConsole
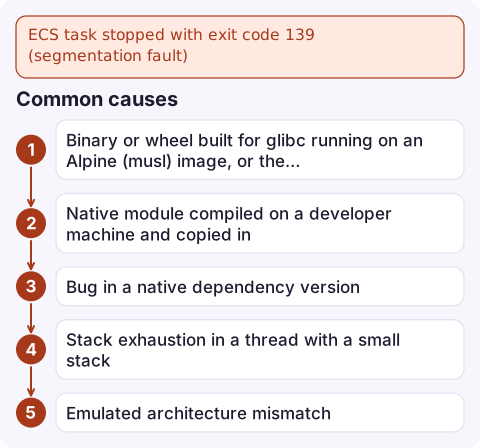
ECS task stopped with exit code 139 (segmentation fault)
Exit code 139 means the process was killed by SIGSEGV (128 + 11): it read or wrote memory it wasn't allowed to. In containers on ECS this almost always comes from native code: a compiled dependency built for a different C library or CPU, a buggy native extension, or a thread running out of stack. Get a stack trace from the crashing process, then rebuild or replace the native component.
What it means
Stopped reason: Essential container in task exited
Containers: app  exitCode: 139
Unlike exit 1, your application didn't decide to exit; the kernel killed it for an illegal memory access. Managed languages (Python, Node.js, Java, Go) don't segfault from ordinary code bugs, so look for whatever native code is running: C extensions, image and PDF libraries, database drivers, JVM or runtime bugs, or binaries copied into the image.
The last log lines before the crash show what the app was doing. Often nothing useful is logged, because the process dies instantly without unwinding.
Common causes
| Cause | Clue |
|---|---|
| Binary or wheel built for glibc running on an Alpine (musl) image, or the reverse | Crashes at import or first use of a library; works in a Debian-based image |
| Native module compiled on a developer machine and copied in | node_modules or a virtualenv copied from macOS or a different distro |
| Bug in a native dependency version | Started after a dependency upgrade; crashes on specific inputs |
| Stack exhaustion in a thread with a small stack | Deep recursion or large stack buffers; often on musl, whose default thread stack is small |
| Emulated architecture mismatch | Image built for one CPU via emulation and run on another; mixed-arch layers |
Get a stack trace
- Python: set
PYTHONFAULTHANDLER=1in the container's environment. On a segfault, Python prints the stack of every thread to stderr, which goes to your log driver. - Node.js: start with
node --report-on-fatalerror; for native crashes a crash-handler module that prints a native backtrace is often more useful. - Java: the JVM writes an
hs_err_pid*.logfile; point it at stdout or a mounted volume with-XX:ErrorFileso it survives the task. - Reproduce locally with the exact image and architecture:
docker run --rm --platform linux/amd64 \
  -e PYTHONFAULTHANDLER=1 123456789012.dkr.ecr.eu-west-2.amazonaws.com/app:v42
Check which architecture the task runs on and which the image provides:
aws ecs describe-task-definition --task-definition app \
  --query 'taskDefinition.runtimePlatform'
docker manifest inspect 123456789012.dkr.ecr.eu-west-2.amazonaws.com/app:v42 | grep architecture
Fix it
- Install native dependencies inside the image build, never by copying them from the host, and add
node_modulesor.venvto.dockerignore. - Match the base image to the binaries. If a library ships glibc builds only, use a Debian or Ubuntu based image instead of Alpine.
- Pin or roll back the native dependency that changed, then report the crash upstream with the stack trace.
- Increase the thread stack size if the trace shows deep recursion (for example
-Xssfor Java, or the threading library's stack size setting). - Roll the service back to the previous task definition revision while you investigate, if the crash came with a deploy.
Questions
What does exit code 139 mean in a Docker container?
The main process was terminated by signal 11 (SIGSEGV), a segmentation fault caused by an invalid memory access, almost always in native code.
Can a memory limit cause exit code 139?
Not directly. Hitting the container's memory limit produces an OOM kill with exit code 137. A 139 points to a crash inside the process.
Why does my container segfault only on ECS and not locally?
The ECS task often runs on a different CPU architecture or with a different image build than your laptop. Reproduce with the exact image digest and --platform set to the task's architecture.

Segfaults tend to appear as tasks restarting in a loop, which shows up as service events and failing health checks. CloudConsole, a phone app for AWS, is built to show those events and the last log lines on your phone so you can decide whether to roll back.
Did it start after a deploy? What changed? on the app’s alarm screen lists the deploys and configuration changes from the hour before the alarm fired.
About the app → · Download on the App Store