 CloudConsole
IAM policy: CloudWatch read-only for a monitoring tool
A monitoring tool needs cloudwatch:GetMetricData, ListMetrics and DescribeAlarms for metrics and alarms, tag:GetResources and a few Describe calls to find resources, and the logs read actions only if it shows log lines. Most CloudWatch read actions don't support resource-level permissions, so they use Resource "*".
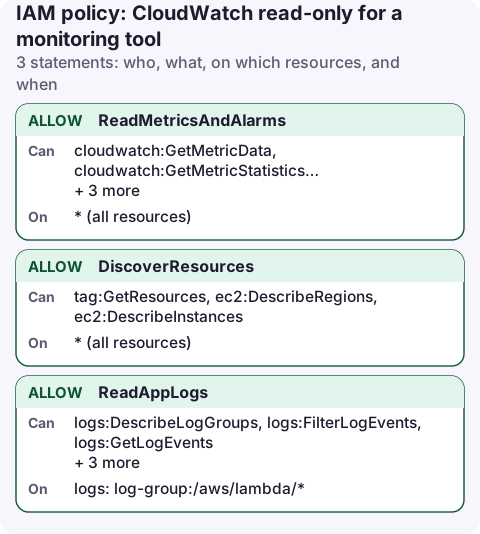
The policy
{
  "Version": "2012-10-17",
  "Statement": [
    {
      "Sid": "ReadMetricsAndAlarms",
      "Effect": "Allow",
      "Action": [
        "cloudwatch:GetMetricData",
        "cloudwatch:GetMetricStatistics",
        "cloudwatch:ListMetrics",
        "cloudwatch:DescribeAlarms",
        "cloudwatch:DescribeAlarmHistory",
        "cloudwatch:DescribeAlarmsForMetric"
      ],
      "Resource": "*"
    },
    {
      "Sid": "DiscoverResources",
      "Effect": "Allow",
      "Action": [
        "tag:GetResources",
        "ec2:DescribeRegions",
        "ec2:DescribeInstances"
      ],
      "Resource": "*"
    },
    {
      "Sid": "ReadAppLogs",
      "Effect": "Allow",
      "Action": [
        "logs:DescribeLogGroups",
        "logs:FilterLogEvents",
        "logs:GetLogEvents",
        "logs:StartQuery",
        "logs:GetQueryResults",
        "logs:StopQuery"
      ],
      "Resource": "arn:aws:logs:eu-west-2:123456789012:log-group:/aws/lambda/*"
    }
  ]
}
What each statement allows
- ReadMetricsAndAlarms:
GetMetricDatais what dashboards use for graphs;GetMetricStatisticsis the older single-metric call some tools still use.ListMetricsfinds which metrics and dimensions exist. The alarm actions read alarm state and history. None of the metric reads accept a resource ARN, so"*"is required. - DiscoverResources: tools such as Grafana use
tag:GetResourcesto turn tags into dimension values andec2:DescribeRegionsto list regions. Add other Describe calls only for the services the tool shows. - ReadAppLogs is optional and scoped to Lambda log groups here. Log lines often contain personal data, tokens and request bodies, so treat log access as data access, not monitoring metadata.
Attach it
For a SaaS monitoring product, put this on a role it assumes with an external ID (see cross-account role with ExternalId). For a self-hosted tool on EC2 or ECS, attach it to the instance or task role:
aws iam put-role-policy --role-name grafana-task \
  --policy-name cloudwatch-read --policy-document file://cloudwatch-read.json

aws cloudwatch describe-alarms --state-value ALARM --profile grafana-test \
  --query 'MetricAlarms[].AlarmName'
Variations
- Managed policy:
CloudWatchReadOnlyAccesscovers metrics, alarms, logs and more on every resource. Fine for engineers, broad for a third-party tool. - No logs at all: delete the third statement. Metrics and alarms alone reveal very little sensitive data.
- Many accounts: CloudWatch cross-account observability lets one monitoring account read metrics and logs from source accounts, so the tool needs a role in one account only.
- Logs Insights limits:
logs:StartQueryscans data and is billed per GB scanned. Restrict the log groups if the tool runs scheduled queries.
Check what the tool can actually see
aws iam simulate-principal-policy \
  --policy-source-arn arn:aws:iam::123456789012:role/grafana-task \
  --action-names cloudwatch:GetMetricData logs:FilterLogEvents cloudwatch:PutMetricAlarm \
  --query 'EvaluationResults[].[EvalActionName,EvalDecision]' --output text
Expect the two reads to be allowed and PutMetricAlarm to be denied. If a dashboard still shows no data, confirm the region and namespace in the tool before changing IAM.
Common mistakes
- Scoping
GetMetricDatato an alarm or namespace ARN. It doesn't support resource-level permissions, so the statement never matches and every graph is empty. - Forgetting
FilterLogEventswhen the tool searches logs;GetLogEventsalone only reads one stream at a time. - Adding
cloudwatch:PutMetricAlarmorSetAlarmState"so the tool can manage alarms". That is write access; give it a separate role if needed. - Wrong region: the policy allows all regions, but the tool must query each region it monitors. Missing data is often a region setting, not IAM.
Questions
Which IAM permissions does Grafana need for CloudWatch?
Typically the metric reads (GetMetricData, ListMetrics, GetMetricStatistics), DescribeAlarms, tag:GetResources and ec2:DescribeRegions, plus the logs read actions if you use the logs data source.
Can I restrict cloudwatch:GetMetricData to one namespace?
Not with a resource ARN. GetMetricData has no resource-level permissions, so the statement must use Resource "*".
A read-only CloudWatch role is the right shape for checking alarms and graphs from a phone during an incident. CloudConsole is being built around that kind of read-only access, with any changes gated behind extra confirmation.
About the app → · Download on the App Store