 CloudConsole
Lambda memory usage with Logs Insights
Every Lambda REPORT line records Memory Size and Max Memory Used, which Logs Insights exposes as @memorySize and @maxMemoryUsed (in bytes). Comparing the maximum used with the configured size shows whether the function is close to running out of memory or is over-provisioned and costing more than it needs to.
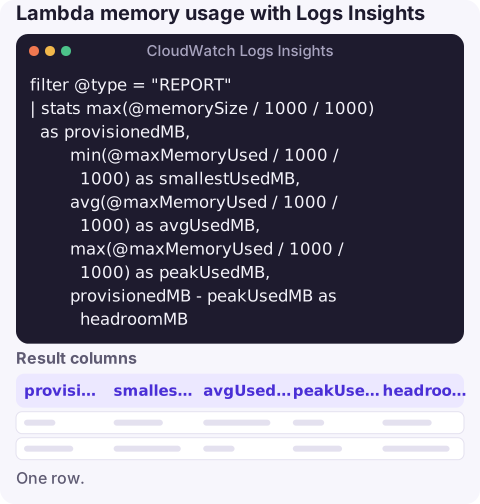
The query
filter @type = "REPORT"
| stats max(@memorySize / 1000 / 1000) as provisionedMB,
        min(@maxMemoryUsed / 1000 / 1000) as smallestUsedMB,
        avg(@maxMemoryUsed / 1000 / 1000) as avgUsedMB,
        max(@maxMemoryUsed / 1000 / 1000) as peakUsedMB,
        provisionedMB - peakUsedMB as headroomMB
The result is a single row summarising the selected period: what the function is configured with, what it typically uses, and how close the worst invocation came to the limit.
How it works
filter @type = "REPORT"keeps one line per invocation, where the memory figures live.@memorySizeis the configured memory and@maxMemoryUsedthe peak resident memory for that invocation, both reported in bytes. Dividing by 1000 twice gives megabytes in the same units Lambda shows in the REPORT line.max,avgandmindescribe the distribution; peak usage matters most for failures, average for right-sizing.- The last expression reuses the aliases to compute headroom directly.
A rule of thumb: if peakUsedMB is within about 10% of provisionedMB, you're at risk of out-of-memory failures as inputs grow. If peak usage is well under half, you may be able to lower memory, though test first, because Lambda allocates CPU in proportion to memory and a smaller setting can make the function slower.
Variations
Invocations close to the limit:
filter @type = "REPORT" and @maxMemoryUsed / @memorySize > 0.9
| fields @timestamp, @requestId, @maxMemoryUsed / 1000 / 1000 as usedMB, @duration
| sort @timestamp desc
Memory trend over time, to spot a leak in long-lived execution environments:
filter @type = "REPORT"
| stats max(@maxMemoryUsed / 1000 / 1000) as peakMB, avg(@maxMemoryUsed / 1000 / 1000) as avgMB by bin(30m)
Out-of-memory failures. When a function exceeds its memory, the runtime is stopped and the log usually shows a runtime exit error mentioning memory, and the invocation's error type can be Runtime.OutOfMemory. Search for both forms:
fields @timestamp, @requestId, @message
| filter @message like /(?i)(out of memory|OutOfMemory|MemoryError|heap out of memory|signal: killed)/
| sort @timestamp desc
| limit 50
The last pattern catches language-level messages (Python MemoryError, Node.js heap errors, Java OutOfMemoryError) as well as the platform's own.
What to do with the result
- Near the limit: raise memory with update-function-configuration and look at what drives peak usage, such as large payloads loaded fully into memory or growing caches in global scope. See Lambda out of memory.
- Plenty of headroom: try a lower setting in a test environment and compare duration and cost.
- Steady growth across a day: something is accumulating in the execution environment between invocations.
Limits and related metrics
Lambda doesn't publish a standard per-invocation memory metric in the AWS/Lambda namespace; the REPORT line is the built-in source, which is why this query is useful. Lambda Insights, if enabled, adds memory utilisation metrics at extra cost. Logs Insights charges per GB scanned and caps results at 10,000 rows, so use stats rather than listing every invocation over long periods.
Questions
What does Max Memory Used mean in Lambda?
The peak memory used during that invocation. Compare it with Memory Size, the configured limit, to see how close the function came to running out.
How do I find Lambda out of memory errors?
Search the log group for messages such as Runtime.OutOfMemory, MemoryError or heap out of memory, and check REPORT lines where Max Memory Used equals Memory Size.
Is there a CloudWatch metric for Lambda memory utilisation?
Not in the standard Lambda metrics. Use the REPORT line through Logs Insights, or enable Lambda Insights for memory metrics.
Out-of-memory failures tend to begin when an input grows, which rarely happens at a convenient time. CloudConsole, a phone app for AWS, is built to show the error alarm and the failing invocations on your phone.
About the app → · Download on the App Store