 CloudConsole
Lambda cold starts and init duration in Logs Insights
A Lambda cold start shows up as an Init Duration value on the invocation's REPORT line, which Logs Insights exposes as @initDuration. Filter REPORT lines where @initDuration is present to list cold starts, and compare their count to all REPORT lines to get the cold-start rate.
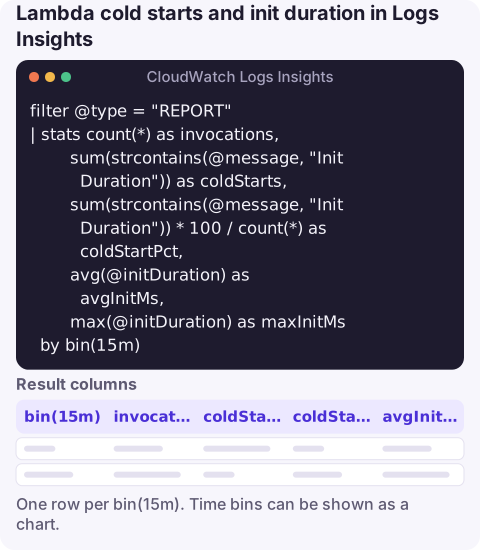
The query
filter @type = "REPORT"
| stats count(*) as invocations,
        sum(strcontains(@message, "Init Duration")) as coldStarts,
        sum(strcontains(@message, "Init Duration")) * 100 / count(*) as coldStartPct,
        avg(@initDuration) as avgInitMs,
        max(@initDuration) as maxInitMs
  by bin(15m)
Run it against the function's log group. Each row is a 15-minute window showing how many invocations ran, how many were cold, the percentage, and how long initialisation took on average and at worst.
Line by line
filter @type = "REPORT"keeps one line per invocation.count(*)counts invocations in the bucket.strcontains(@message, "Init Duration")returns 1 when the REPORT line includes an init phase and 0 otherwise, sosum(...)counts cold starts. Dividing bycount(*)and multiplying by 100 gives the percentage.avg(@initDuration)andmax(@initDuration)only consider events where the field exists, so warm invocations don't drag the average down.by bin(15m)gives a time series you can chart.
@initDuration covers the init phase: starting the runtime and running your code outside the handler (imports, SDK clients, configuration loading). It isn't part of @duration, so a cold invocation's total wait is roughly the two added together.
Variations
List the individual cold starts, slowest first:
filter @type = "REPORT" and ispresent(@initDuration)
| fields @timestamp, @requestId, @initDuration, @duration, @logStream
| sort @initDuration desc
| limit 50
Cold starts per function version. Log stream names begin with the date and the version in square brackets, so you can compare a new deployment against the old one:
filter @type = "REPORT" and ispresent(@initDuration)
| parse @logStream "*/[*]*" as day, version, rest
| stats count(*) as coldStarts, avg(@initDuration) as avgInitMs by version
Across several functions: select multiple log groups and group by @log.
Interpreting the numbers
- Cold starts cluster after deployments, scale-ups and idle periods. A burst right after a release is expected; a steady high percentage suggests traffic is too spiky or too sparse to keep environments warm.
- Large init duration usually comes from heavy package size, many imports, or network calls made at start-up. Move lazy work into the handler or cache it, and trim dependencies.
- Provisioned concurrency runs initialisation before requests arrive, so its invocations shouldn't report an init phase; if you still see many, traffic is spilling over the provisioned amount onto on-demand environments.
- SnapStart functions restore from a snapshot rather than initialising from scratch, and their REPORT lines show a restore duration instead; adjust the
strcontainstext accordingly.
Limits and cost
The query scans the whole log group for the selected period, including all application log lines, not just REPORT lines, so verbose functions cost more to analyse. Narrow the time range first. For long-term tracking, there is no built-in CloudWatch metric for init duration; if you need one, publish it yourself (for example with embedded metric format) rather than re-running this query on a dashboard every minute.
Questions
How do I find Lambda cold starts in CloudWatch?
Run a Logs Insights query on the function's log group for REPORT lines where @initDuration is present. Each such line is one cold start.
Is init duration included in Lambda duration?
No. @duration measures the handler; @initDuration is reported separately for cold starts.
How do I reduce Lambda cold starts?
Reduce package size and start-up work, keep traffic steady, or use provisioned concurrency or SnapStart where supported.
Cold-start spikes often follow a deploy, just as you've stepped away. CloudConsole, a phone app for AWS, is built to show latency alarms and the logs behind them on your phone.
About the app → · Download on the App Store