 CloudConsole
Find the slowest Lambda invocations with Logs Insights
Query the function's log group for REPORT lines, which carry @duration, and sort by it: filter @type = "REPORT" | sort @duration desc | limit 25. That gives the slowest invocations with their request IDs, which you can then use to pull every log line from those specific requests.
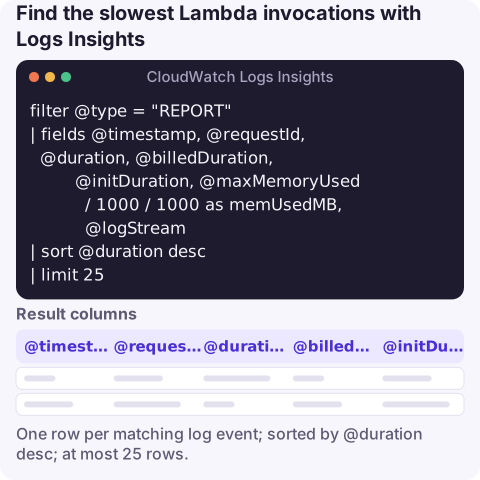
The query
filter @type = "REPORT"
| fields @timestamp, @requestId, @duration, @billedDuration,
         @initDuration, @maxMemoryUsed / 1000 / 1000 as memUsedMB, @logStream
| sort @duration desc
| limit 25
Select the log group /aws/lambda/my-function (or whatever custom log group the function writes to) and a time range that covers the slow period.
How it works
filter @type = "REPORT": Lambda writes oneREPORTline at the end of every invocation. Logs Insights recognises it and sets@type, so this filter gives exactly one row per invocation.fields …: these fields are parsed from the REPORT line automatically.@durationand@billedDurationare in milliseconds;@initDurationonly exists for invocations that started a new execution environment;@maxMemoryUsedis in bytes, hence the division.sort @duration descputs the slowest first.limit 25keeps the list readable; raise it if you need more.
When reading the output: if the slow rows have a large @initDuration, you're looking at cold starts (see cold-start queries). If @duration sits at the configured timeout, those invocations didn't finish (see Lambda timeouts). Otherwise, the time is being spent inside your handler.
Also compare the slow rows' @logStream values. If they all come from one or two streams, a few execution environments are misbehaving (a stuck connection pool, a growing cache); if they're spread evenly, the cause is more likely a shared dependency or the input data.
Variations
Duration percentiles over time, to see whether slowness is constant or a spike:
filter @type = "REPORT"
| stats count(*) as invocations, pct(@duration, 50) as p50, pct(@duration, 99) as p99, max(@duration) as maxMs by bin(5m)
Everything one slow request logged. Copy a request ID from the first query and search the same log group:
fields @timestamp, @message
| filter @message like "8f2c6d1e-0b7a-4a51-9a3e-2f1c0d9b7e44"
| sort @timestamp asc
Slow calls inside the handler. If your code logs timings, aggregate them by dependency:
filter ispresent(dependency) and ispresent(elapsedMs)
| stats count(*) as calls, pct(elapsedMs, 95) as p95 by dependency
| sort p95 desc
Functions using JSON log format. When a function's log format is set to JSON, the platform summary arrives as a platform.report event with metrics under record.metrics, so filter on type = "platform.report" and sort by record.metrics.durationMs instead.
Limits and cost
- Each query is charged per GB scanned in the selected log group and time range. Busy functions with verbose logging make wide time ranges expensive; start with the hour around the problem.
- Results are capped at 10,000 rows, which matters only if you list raw REPORT lines over a long period. Use
statsfor trends. - The
Durationmetric in CloudWatch gives percentiles too, without scanning logs. Use the metric for alarms (see Lambda Duration alarm) and Logs Insights to find which invocations were slow.
Questions
How do I see Lambda duration in CloudWatch Logs Insights?
Filter on @type = "REPORT" and read @duration, which Logs Insights parses from each invocation's REPORT line, in milliseconds.
What's the difference between @duration and @billedDuration?
@duration is the measured run time; @billedDuration is what you're charged for, rounded up to Lambda's billing granularity and including init time where it applies.
Why is @initDuration empty on most rows?
It's only present when the invocation started a new execution environment (a cold start). Warm invocations have no init phase.
Slow Lambda invocations usually surface as a latency alarm while you're doing something else. CloudConsole, a phone app for AWS, is built to show that alarm and the slowest invocations behind it on your phone.
About the app → · Download on the App Store