 CloudConsole
Percentile latency with CloudWatch Logs Insights
Use the pct(field, N) function inside stats to get the Nth percentile of a numeric field: stats pct(latency, 50), pct(latency, 95), pct(latency, 99) by bin(5m). Percentiles show what most users experience and how bad the slow tail is, which an average hides.
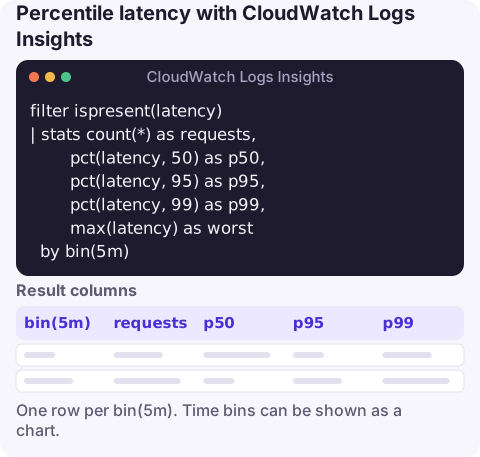
The query
filter ispresent(latency)
| stats count(*) as requests,
        pct(latency, 50) as p50,
        pct(latency, 95) as p95,
        pct(latency, 99) as p99,
        max(latency) as worst
  by bin(5m)
This works on any log group where each request writes a numeric latency field, such as API Gateway access logs in JSON format or your own structured application logs. For Lambda, use @duration on REPORT lines instead.
How it works
filter ispresent(latency)drops events without the field so they don't distort the counts.pct(latency, 50)is the median: half of requests were faster.p95andp99are the values that 95% and 99% of requests came in under.max(latency)is the single worst request, useful but noisy; one stuck request can dominate it.count(*)matters for interpretation. A p99 over 50 requests is effectively the slowest one; it needs hundreds of requests per bucket to be meaningful.by bin(5m)makes it a time series for the Visualization tab.
Variations
Per route, to find which endpoint owns the tail:
filter ispresent(latency)
| stats count(*) as n, pct(latency, 95) as p95, pct(latency, 99) as p99 by method, path
| sort p99 desc
| limit 20
Read the n column alongside p99: a route with a dozen requests can top the list on a single slow call, so give more weight to routes with real traffic.
Lambda duration percentiles:
filter @type = "REPORT"
| stats pct(@duration, 50) as p50, pct(@duration, 99) as p99 by bin(15m)
Latency from text logs, after extracting the number:
parse @message "took *ms" as tookMs
| filter ispresent(tookMs)
| stats pct(tookMs, 95) as p95 by bin(5m)
Backend versus gateway time in API Gateway access logs, if you log both $context.responseLatency and $context.integrationLatency:
stats pct(latency, 99) as totalP99, pct(integrationLatency, 99) as backendP99 by bin(5m)If the two track each other, the backend is slow; a gap means time is spent in API Gateway itself, for example in an authoriser.
Getting the numbers right
- Units. API Gateway latencies are in milliseconds, as is Lambda's
@duration. Application logs vary; check before comparing. - Numbers, not strings. If the access log format wraps a latency in quotes, it's logged as a string. Log numeric variables unquoted so percentile and comparison functions treat them as numbers.
- Don't average percentiles. The average of five p99s isn't the p99 of the hour. Recalculate over the range you care about.
- Compare like with like. Use the same bin size and time of day when comparing a release with the previous one.
Limits and when to use metrics instead
Queries are billed for data scanned, and each run recalculates from raw events, so a dashboard widget that re-runs a percentile query every minute over large log groups adds up. For continuous tracking and alarms, the built-in Latency and IntegrationLatency metrics (API Gateway) and Duration (Lambda) support percentile statistics such as p99 directly. Use Logs Insights when you need a breakdown the metrics don't have, such as per user, per tenant or per route.
Questions
How do I calculate p99 in CloudWatch Logs Insights?
Use pct(field, 99) inside stats, for example stats pct(@duration, 99) by bin(5m).
Why is my p99 equal to the max?
There are too few events per bucket. With fewer than about 100 requests in a bucket, the 99th percentile is effectively the slowest request; use a bigger bin.
Can I alarm on a Logs Insights percentile?
Not directly. Alarm on a metric with a percentile statistic, such as Lambda Duration p99, or publish your own metric from logs.
A p99 alarm is the classic one to receive while you're away from a keyboard. CloudConsole, a phone app for AWS, is built to show the alarm and the log breakdown behind it on your phone.
About the app → · Download on the App Store