 CloudConsole
API Gateway Count alarm by Resource and Method (REST API)
This variant of the low-traffic alarm watches a single REST API resource and method, using the dimensions ApiName, Stage, Resource and Method. It needs detailed CloudWatch metrics on the stage and fires when the SampleCount of Count is below your threshold for 10 of 10 one-minute periods.
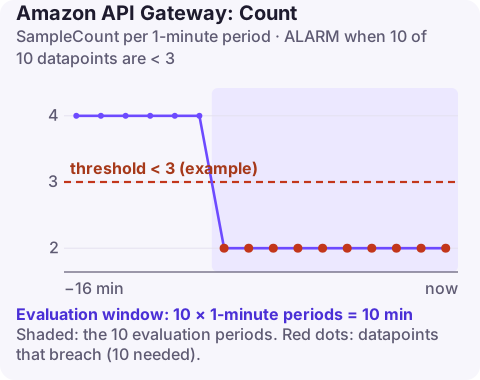
Stage-level or per-method: which one you need
The stage-level Count alarm tells you the whole API has gone quiet. It misses partial failures: if POST /orders stops receiving calls because a front-end change broke the checkout button, the stage total may barely move because GET /products traffic dominates.
| Stage alarm | Per-method alarm | |
|---|---|---|
| Dimensions | ApiName, Stage | ApiName, Stage, Resource, Method |
| Needs detailed metrics | No | Yes (extra charge per metric) |
| Catches | Whole API unreachable | One endpoint abandoned or broken |
| Best for | Every steady API | A few business-critical endpoints |
Recommended settings
| Setting | Value |
|---|---|
| Namespace | AWS/ApiGateway |
| Metric | Count |
| Dimensions | ApiName, Stage, Resource, Method |
| Statistic | SampleCount |
| Period | 60 seconds |
| Datapoints to alarm | 10 |
| Evaluation periods | 10 |
| Comparison operator | LessThanThreshold |
| Threshold | Depends on your situation: based on that method's own baseline |
From AWS's CloudWatch recommended alarms. Resource is the resource path as defined in the API, including path parameters, for example /orders/{orderId}; Method is the HTTP verb such as POST.
Turning on detailed metrics and finding the dimension values
aws apigateway update-stage --rest-api-id a1b2c3d4e5 --stage-name prod \
  --patch-operations op=replace,path=/*/*/metrics/enabled,value=true

# Then list the exact Resource/Method values API Gateway publishes
aws cloudwatch list-metrics --namespace AWS/ApiGateway --metric-name Count \
  --dimensions Name=ApiName,Value=orders-api Name=Stage,Value=prod
Detailed metrics create a set of metrics for every resource and method, so on a large API the CloudWatch bill is noticeable. You can enable them for the stage, alarm on the two or three endpoints that matter, and accept the cost, or enable them only on specific methods with a narrower patch path.
Picking a threshold per endpoint
Endpoints have very different shapes. A checkout POST may see five calls a minute at 4am and 300 at lunchtime, so a fixed threshold that catches a breakage at lunch is useless at night. Two workable approaches:
- Floor threshold: find the lowest one-minute count over two weeks for that method and alarm below half of it. Simple, but only catches a near-total stop.
- Ratio: use metric math to divide this method's count by the stage's count and alarm when the share drops sharply. A checkout that normally takes 3% of requests and falls to 0.2% is broken even if traffic overall is low.
Whichever you choose, treat missing data as breaching: a method nobody calls publishes no datapoints.
Create it
# Example threshold: 3 requests per minute
aws cloudwatch put-metric-alarm \
  --alarm-name orders-api-prod-post-orders-low \
  --namespace AWS/ApiGateway \
  --metric-name Count \
  --dimensions Name=ApiName,Value=orders-api Name=Stage,Value=prod Name=Resource,Value=/orders Name=Method,Value=POST \
  --statistic SampleCount \
  --period 60 \
  --evaluation-periods 10 \
  --datapoints-to-alarm 10 \
  --threshold 3 \
  --comparison-operator LessThanThreshold \
  --treat-missing-data breaching \
  --alarm-actions arn:aws:sns:eu-west-2:123456789012:ops-alerts \
  --region eu-west-2
When it fires, start with the client: browser console errors on the page that calls the endpoint, or the mobile app's crash reports. If clients are calling but requests never arrive, check CORS preflight failures (CORS errors) and recent changes to the resource's authorizer or request validator.
Questions
Do I need detailed metrics for a per-method Count alarm?
Yes. Without detailed CloudWatch metrics on the stage, API Gateway publishes Count only per ApiName and Stage, and an alarm with Resource and Method dimensions gets no data.
What value do I put in the Resource dimension?
The resource path as defined in the API, with path parameters in braces, such as /orders/{orderId}. Run list-metrics to see the exact values.
Is a per-method alarm worth the cost?
For a handful of revenue-critical endpoints, usually yes. Avoid enabling it for every method on a large API unless you need the data.
A broken checkout endpoint can go unnoticed while the rest of the API looks healthy. CloudConsole, a phone app for AWS, is built to surface per-endpoint alarms and traffic graphs on a phone so partial outages are visible too.
Did it start after a deploy? What changed? on the app’s alarm screen lists the deploys and configuration changes from the hour before the alarm fired.
About the app → · Download on the App Store