 CloudConsole
API Gateway Latency alarm by Resource and Method (REST API)
The per-method variant alarms on p90 Latency with the ApiName, Stage, Resource and Method dimensions, firing at 2,500 ms or more for 5 of 5 one-minute periods. Use it when endpoints in the same stage have different response-time expectations; it requires detailed CloudWatch metrics on the stage.
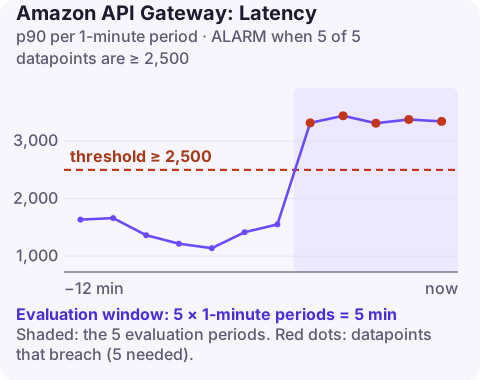
Why split latency by endpoint
A stage-wide p90 blends fast and slow endpoints together. If GET /health and GET /products make up most of the traffic, a checkout endpoint can triple in latency without moving the stage figure. The opposite also happens: one legitimately slow export endpoint keeps the stage-level alarm close to its threshold all day.
Per-method alarms let you give each important endpoint its own limit. Keep the stage alarm as a backstop and add these for the handful of endpoints where response time is part of the product.
Recommended settings
| Setting | Value |
|---|---|
| Namespace | AWS/ApiGateway |
| Metric | Latency |
| Dimensions | ApiName, Stage, Resource, Method |
| Statistic | p90 |
| Period | 60 seconds |
| Datapoints to alarm | 5 |
| Evaluation periods | 5 |
| Comparison operator | GreaterThanOrEqualToThreshold |
| Threshold | 2500.0 (milliseconds) |
Settings from AWS's recommended alarms page. Resource is the path template (for example /orders/{orderId}), and Method the HTTP verb. Detailed metrics must be switched on for these dimensions to exist.
Setting a threshold for each endpoint
Use 2,500 ms only as a placeholder. For each endpoint you alarm on:
- Graph its p90 over two weeks and note the highest healthy value, ignoring known incidents.
- Write down what users would call "slow" for that action: a search box and a PDF export have very different tolerances.
- Set the threshold between the two, nearer the user expectation.
Low-volume endpoints produce jumpy percentiles. If an endpoint gets fewer than ten requests a minute, add --evaluate-low-sample-count-percentile ignore, or alarm over a longer period. Leave missing data as notBreaching so idle minutes are not treated as slow.
Create it
aws apigateway update-stage --rest-api-id a1b2c3d4e5 --stage-name prod \
  --patch-operations op=replace,path=/*/*/metrics/enabled,value=true
aws cloudwatch put-metric-alarm \
--alarm-name orders-api-get-order-p90 \
--namespace AWS/ApiGateway \
--metric-name Latency \
--dimensions Name=ApiName,Value=orders-api Name=Stage,Value=prod Name=Resource,Value=/orders/{orderId} Name=Method,Value=GET \
--extended-statistic p90 \
--period 60 \
--evaluation-periods 5 \
--datapoints-to-alarm 5 \
--threshold 2500 \
--comparison-operator GreaterThanOrEqualToThreshold \
--treat-missing-data notBreaching \
--alarm-actions arn:aws:sns:eu-west-2:123456789012:ops-alerts \
--region eu-west-2The braces in {orderId} are literal; they must match the resource path exactly as defined.
When it fires
- Compare this method's
Latencywith itsIntegrationLatency. Close together means the backend for this endpoint is slow; investigate that integration specifically (a missing database index for one query is a common culprit). - If only this endpoint's integration latency rose after a deploy, roll back or check the changed code path.
- If integration latency is flat, look at endpoint-specific gateway work: a request validator or mapping template on this method, or a different authorizer.
- The re:Post guide on API Gateway latency with Lambda and the article on locating latency for edge-optimised APIs cover deeper diagnosis.
Questions
How do I get API Gateway latency per endpoint?
Enable detailed CloudWatch metrics on the stage. API Gateway then publishes Latency with Resource and Method dimensions as well as the stage totals.
Do detailed metrics cost money?
Yes, they are billed as custom metrics, one set per resource and method, so enable them where you need the detail.
Should I remove the stage-level latency alarm?
No. Keep it as a broad safety net and use per-method alarms for endpoints with their own targets.
Slow checkout is a revenue problem even when everything else is fast. CloudConsole, a phone app for AWS, is built to show per-endpoint latency alarms and their history on a phone.
Did it start after a deploy? What changed? on the app’s alarm screen lists the deploys and configuration changes from the hour before the alarm fired.
About the app → · Download on the App Store