 CloudConsole
CloudWatch alarm for API Gateway Count (HTTP API stage)
For an HTTP API, alarm on Count with SampleCount, dimensions ApiId and Stage, when the request count is below your threshold for 10 consecutive one-minute periods. Pick the threshold from your quietest normal traffic and treat missing data as breaching.
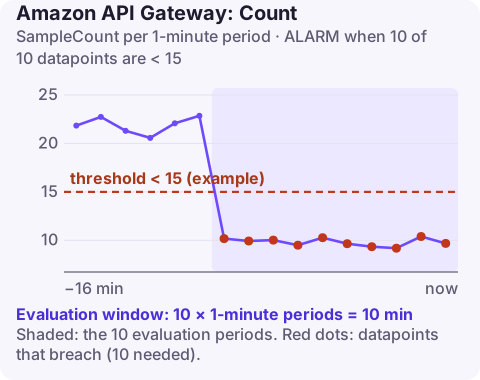
Why HTTP APIs need their own Count alarm
HTTP APIs publish Count under ApiId rather than ApiName, so the REST version cannot be reused by changing the name. The metric means the same thing: one sample per request received by the stage, so SampleCount per minute equals requests per minute.
Things that make an HTTP API suddenly quiet, while every error alarm stays happy:
- a custom domain's API mapping pointed at another API or stage;
- the
execute-apiendpoint disabled after moving clients to a custom domain, with a few callers still on the old URL; - an expired or replaced certificate on the custom domain, so TLS fails before any request is counted;
- an upstream producer (a partner webhook, a scheduled job) silently stopping.
Recommended settings
| Setting | Value |
|---|---|
| Namespace | AWS/ApiGateway |
| Metric | Count |
| Dimensions | ApiId, Stage |
| Statistic | SampleCount |
| Period | 60 seconds |
| Datapoints to alarm | 10 |
| Evaluation periods | 10 |
| Comparison operator | LessThanThreshold |
| Threshold | Depends on your situation: derive it from historical request counts |
As published in the CloudWatch recommended alarms reference. AWS suggests it only where traffic is predictable.
A concrete way to set the threshold
HTTP APIs often front webhooks and machine-to-machine traffic with a clear daily rhythm, which suits anomaly detection better than a fixed line. If you prefer a static threshold:
- Chart
Count(SampleCount, one-minute period) for the last 14 days in the console. - Switch the statistic to look at the hourly view and note the quietest hour.
- Zoom into that hour and read the lowest one-minute value; set the threshold below it with margin, typically 40–60% of it.
- Recheck after big traffic changes; a threshold set during launch week ages quickly.
If the quietest minute is zero, a static low-traffic alarm will not work for that API. Use a scheduled synthetic request instead.
Create it
# 15 requests/minute is an example threshold
aws cloudwatch put-metric-alarm \
  --alarm-name webhooks-http-api-low-traffic \
  --namespace AWS/ApiGateway \
  --metric-name Count \
  --dimensions Name=ApiId,Value=a1b2c3d4e5 Name=Stage,Value=prod \
  --statistic SampleCount \
  --period 60 \
  --evaluation-periods 10 \
  --datapoints-to-alarm 10 \
  --threshold 15 \
  --comparison-operator LessThanThreshold \
  --treat-missing-data breaching \
  --alarm-actions arn:aws:sns:eu-west-2:123456789012:ops-alerts \
  --region eu-west-2
breaching matters here: no requests means no datapoints, and you want that to count as a drop.
When it fires
- Call the API through the custom domain and through the default
execute-apiURL. If only the custom domain fails, check the API mapping and certificate withaws apigatewayv2 get-api-mappings --domain-name api.example.com. - Ask whether the main caller changed: a partner rotating their webhook target, a client release with a new base URL.
- Check the stage's access logs for the last requests before the drop; their source and user agent tell you which caller disappeared.
- If traffic has legitimately moved to a new API or stage, move the alarm with it.
Questions
Does an HTTP API publish a datapoint when there is no traffic?
No. Minutes without requests have no datapoint, so the alarm must treat missing data as breaching to detect a full stop.
Can I use the same alarm for REST and HTTP APIs?
No. REST APIs use the ApiName dimension and HTTP APIs use ApiId, so each needs its own alarm.
What Stage value does the default stage use?
The auto-deployed default stage is named $default; quote it in shell commands.
A partner quietly stopping their webhooks is the kind of thing you hear about days later. CloudConsole, a phone app for AWS, is built to put traffic-drop alarms on your phone with the graph that shows when the calls stopped.
Did it start after a deploy? What changed? on the app’s alarm screen lists the deploys and configuration changes from the hour before the alarm fired.
About the app → · Download on the App Store