 CloudConsole
API Gateway Count alarm for one HTTP API route
To catch one HTTP API route going quiet, alarm on Count (SampleCount) with per-route detailed metrics enabled, below your threshold for 10 of 10 one-minute periods. AWS lists the dimensions as ApiId, Stage, Resource and Method; confirm the names your API actually publishes with list-metrics before creating it.
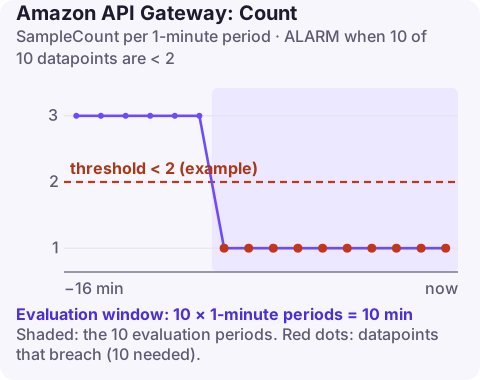
When a per-route alarm earns its keep
The stage-level HTTP API Count alarm only notices when the whole API goes quiet. A per-route alarm catches a single broken flow: a webhook route a partner stopped calling, a POST /signup route that a front-end change no longer reaches. Use it for the few routes where silence means lost business, not for every route.
It needs detailed metrics on the stage, which publish a set of metrics per route and are billed as custom metrics.
Recommended settings
| Setting | Value |
|---|---|
| Namespace | AWS/ApiGateway |
| Metric | Count |
| Dimensions | ApiId, Stage, Resource, Method |
| Statistic | SampleCount |
| Period | 60 seconds |
| Datapoints to alarm | 10 |
| Evaluation periods | 10 |
| Comparison operator | LessThanThreshold |
| Threshold | Depends on your situation: per-route baseline |
Settings from the CloudWatch recommended alarms page. Check the dimensions: AWS's table lists Resource and Method, the names REST APIs use. The HTTP API metrics documentation describes per-route data under a single Route dimension whose value is the route key, such as POST /signup. Whichever your account shows is what the alarm must use; an alarm on dimension names that are not published stays in INSUFFICIENT_DATA.
Enable detailed metrics and confirm the dimensions
aws apigatewayv2 update-stage --api-id a1b2c3d4e5 --stage-name prod \
  --default-route-settings DetailedMetricsEnabled=true

aws cloudwatch list-metrics --namespace AWS/ApiGateway --metric-name Count \
  --dimensions Name=ApiId,Value=a1b2c3d4e5 Name=Stage,Value=prod \
  --query "Metrics[].Dimensions"
Send a few test requests after enabling it; metrics only appear once a route has traffic.
Create it
# Published dimension set. If list-metrics shows a Route dimension instead,
# replace Resource and Method with:  Name=Route,Value="POST /signup"
aws cloudwatch put-metric-alarm \
  --alarm-name signup-route-low-traffic \
  --namespace AWS/ApiGateway \
  --metric-name Count \
  --dimensions Name=ApiId,Value=a1b2c3d4e5 Name=Stage,Value=prod Name=Resource,Value=/signup Name=Method,Value=POST \
  --statistic SampleCount \
  --period 60 \
  --evaluation-periods 10 \
  --datapoints-to-alarm 10 \
  --threshold 2 \
  --comparison-operator LessThanThreshold \
  --treat-missing-data breaching \
  --alarm-actions arn:aws:sns:eu-west-2:123456789012:ops-alerts \
  --region eu-west-2
Choose the threshold from the route's own history: find its quietest healthy minute over a fortnight and alarm below roughly half of it. Routes with genuinely idle minutes need either a longer period than one minute or a synthetic canary instead of this alarm.
When it fires
- Is the route still defined?
aws apigatewayv2 get-routes --api-id a1b2c3d4e5. A route key changed fromPOST /signuptoPOST /v2/signupin a deploy moves the traffic and empties this metric. - Are callers getting errors before routing? Requests rejected by CORS preflight in a browser never reach the route.
- Did the caller change? For webhook routes, check the sender's delivery dashboard or retry logs.
- Is it legitimately quieter? If a feature was retired, delete the alarm rather than raising the threshold to zero.
Questions
What dimension identifies a route in HTTP API metrics?
AWS's recommended-alarm table lists Resource and Method, while the HTTP API metrics reference describes a Route dimension. Run list-metrics on your API and use whatever it returns.
Why is my per-route Count alarm in INSUFFICIENT_DATA?
Usually detailed metrics are off, the route has had no traffic since they were enabled, or the dimension names or values do not exactly match what is published.
Does detailed metrics cost extra?
Yes. Per-route metrics are charged as CloudWatch custom metrics, so enable them where you will use them.
Per-route silence is subtle: the API looks healthy while one flow is dead. CloudConsole, a phone app for AWS, is built to show route-level alarms and their traffic on a phone so these partial failures stand out.
Did it start after a deploy? What changed? on the app’s alarm screen lists the deploys and configuration changes from the hour before the alarm fired.
About the app → · Download on the App Store