 CloudConsole
API Gateway Latency alarm per HTTP API route
To watch one HTTP API route, alarm on p90 Latency at or above 2,500 ms for 5 of 5 one-minute periods with per-route detailed metrics turned on. AWS lists the dimensions as ApiId, Stage, Resource and Method; check with list-metrics which names your API publishes, since HTTP API route data is documented under a Route dimension.
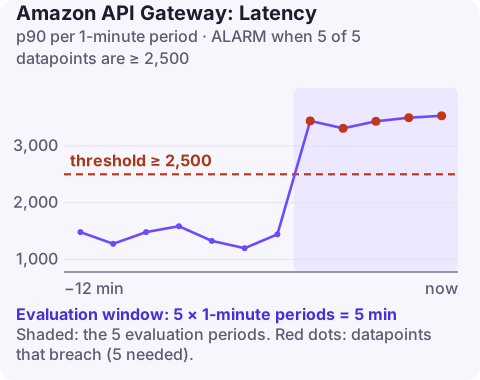
Why a per-route latency alarm
HTTP APIs often mix very different work behind one stage: a quick token-check route next to a route that calls three downstream services. The stage-level latency alarm blends them. A route-level alarm lets the heavy route have a higher threshold without blinding you to slowness on the light ones, and points straight at the culprit when it fires.
Recommended settings
| Setting | Value |
|---|---|
| Namespace | AWS/ApiGateway |
| Metric | Latency |
| Dimensions | ApiId, Stage, Resource, Method |
| Statistic | p90 |
| Period | 60 seconds |
| Datapoints to alarm | 5 |
| Evaluation periods | 5 |
| Comparison operator | GreaterThanOrEqualToThreshold |
| Threshold | 2500.0 (milliseconds) |
From the CloudWatch recommended alarms page. About the dimensions: Resource and Method are what AWS's table shows (and what REST APIs use). The HTTP API metrics documentation instead describes a Route dimension holding the route key, such as GET /orders/{id}. Run the list-metrics command below and copy exactly what comes back.
Turn on detailed metrics and confirm names
aws apigatewayv2 update-stage --api-id a1b2c3d4e5 --stage-name prod \
  --default-route-settings DetailedMetricsEnabled=true

aws cloudwatch list-metrics --namespace AWS/ApiGateway --metric-name Latency \
  --dimensions Name=ApiId,Value=a1b2c3d4e5 \
  --query "Metrics[].Dimensions[].[Name,Value]" --output text | sort -u
Per-route metrics are charged as custom metrics, so enable them for the stage only if you plan to use them, or turn them on for selected routes with route settings.
Create it
# Dimensions as published by AWS. If list-metrics shows a Route dimension,
# use Name=Route,Value="GET /orders/{id}" in place of Resource and Method.
aws cloudwatch put-metric-alarm \
  --alarm-name shop-get-order-route-p90 \
  --namespace AWS/ApiGateway \
  --metric-name Latency \
  --dimensions Name=ApiId,Value=a1b2c3d4e5 Name=Stage,Value=prod Name=Resource,Value=/orders/{id} Name=Method,Value=GET \
  --extended-statistic p90 \
  --period 60 \
  --evaluation-periods 5 \
  --datapoints-to-alarm 5 \
  --threshold 2500 \
  --comparison-operator GreaterThanOrEqualToThreshold \
  --treat-missing-data notBreaching \
  --alarm-actions arn:aws:sns:eu-west-2:123456789012:ops-alerts \
  --region eu-west-2
Threshold for one route: take that route's p90 for the last two weeks, find the worst healthy hour, and add a margin of 30–50%. A route that normally answers in 120 ms deserves a far lower threshold than 2,500 ms; a route that fans out to slow partners may need more. Routes with only a few calls a minute benefit from --evaluate-low-sample-count-percentile ignore.
When it fires
- Check the route's IntegrationLatency (same dimensions). If it tracks
Latency, the backend for this route is slow: look at that Lambda function's duration or the downstream services it calls. - Look for a deploy that changed the route's integration or authorizer.
- Sample slow requests from the access logs using
$context.responseLatencyand$context.requestId, then trace them in the backend logs. - The re:Post article on high latency with Lambda integrations covers the typical backend causes.
Questions
Which dimension names should I use for an HTTP API route alarm?
Whatever list-metrics returns for your API. AWS's recommended-alarm table shows Resource and Method, but the HTTP API metrics reference documents per-route data under a Route dimension.
Why does my per-route latency alarm have no data?
Detailed metrics are off, the route has not been called since they were enabled, or the dimension names or values do not match exactly, including spaces and braces.
Should every route have a latency alarm?
No. Pick the routes users wait on directly and keep the stage-level alarm for everything else.
A single slow route can hurt more users than a slow stage average suggests. CloudConsole, a phone app for AWS, is built to show route-level alarms and their latency history on a phone.
Did it start after a deploy? What changed? on the app’s alarm screen lists the deploys and configuration changes from the hour before the alarm fired.
About the app → · Download on the App Store