 CloudConsole
CloudWatch alarm for API Gateway Latency (REST API stage)
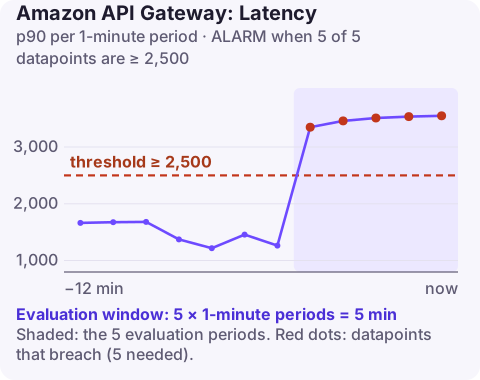
Alarm on the p90 of Latency for each REST API stage (ApiName, Stage) and go into ALARM when it is at or above 2,500 milliseconds for 5 of 5 one-minute periods. When it fires, compare it with IntegrationLatency: if the two move together the backend is slow; if the gap widens, the time is being spent inside API Gateway.
Latency versus IntegrationLatency
Latency runs from the moment API Gateway receives a request to the moment it sends the response. IntegrationLatency covers only the time between API Gateway sending the request to your backend and getting a response back. The difference is API Gateway's own work: authorizer calls (when not cached), request validation, mapping templates, and any WAF evaluation in front of the stage.
| Pattern | Points to |
|---|---|
| Both rise together | Backend: Lambda duration, database, downstream API |
Latency rises, IntegrationLatency flat | Lambda authorizer slow or cache disabled, heavy mapping templates, edge-optimised endpoint routing |
Latency falls sharply | Caching now serving responses, or requests failing fast (check 4XXError) |
Recommended alarm settings
| Setting | Value |
|---|---|
| Namespace | AWS/ApiGateway |
| Metric | Latency |
| Dimensions | ApiName, Stage |
| Statistic | p90 |
| Period | 60 seconds |
| Datapoints to alarm | 5 |
| Evaluation periods | 5 |
| Comparison operator | GreaterThanOrEqualToThreshold |
| Threshold | 2500.0 (milliseconds) |
As published in the CloudWatch recommended alarms list. p90 means 90% of requests in the minute were faster than the value, so the alarm reacts to a slow tail without being dominated by single outliers the way Maximum is.
Tuning the 2,500 ms starting point
- Fit it to your SLO. An API whose users expect 300 ms responses should alarm well below 2,500 ms; pull the last 14 days of p90 and set the threshold about 50% above the normal peak.
- Remember the ceiling. The REST API integration timeout is 29 seconds by default, so a p90 of several seconds is already a sign of trouble for most APIs.
- Low traffic and percentiles: with only a handful of requests per minute, p90 is decided by one or two calls. CloudWatch's
--evaluate-low-sample-count-percentile ignoreoption keeps the alarm in its current state when there are too few samples for the percentile to be meaningful. - Different endpoints, different needs: if one report endpoint is legitimately slow, it drags the stage p90 up. Split it out with per-method latency alarms.
Create it
aws cloudwatch put-metric-alarm \
  --alarm-name orders-api-prod-p90-latency \
  --namespace AWS/ApiGateway \
  --metric-name Latency \
  --dimensions Name=ApiName,Value=orders-api Name=Stage,Value=prod \
  --extended-statistic p90 \
  --period 60 \
  --evaluation-periods 5 \
  --datapoints-to-alarm 5 \
  --threshold 2500 \
  --comparison-operator GreaterThanOrEqualToThreshold \
  --treat-missing-data notBreaching \
  --alarm-actions arn:aws:sns:eu-west-2:123456789012:ops-alerts \
  --region eu-west-2
When it fires
- Graph
LatencyandIntegrationLatencyat p90 on the same chart for the last three hours. - Backend slow: for Lambda, check
Duration,ConcurrentExecutionsand cold starts (cold starts in Logs Insights); the re:Post guide on high latency with Lambda integrations lists the common causes. - Gap widening: check the authorizer's duration and whether its result caching was changed; for edge-optimised endpoints, read the re:Post article on finding the source of latency.
- Find the slow endpoint: add
$context.resourcePathand$context.responseLatencyto the access log format, then rank by p90 with percentile latency in Logs Insights.
Questions
What is a good latency threshold for API Gateway?
AWS suggests 2,500 ms at p90 as a starting point. Most interactive APIs set something lower, based on their own p90 history and the response time users expect.
Why p90 and not Average?
Average hides a slow tail: if 15% of requests take 5 seconds, the average can still look fine. p90 shows what most users experience at the slow end.
Does Latency include Lambda cold starts?
Yes. A cold start lengthens IntegrationLatency, which is part of Latency.
Latency alarms are judgement calls: sometimes it is a blip, sometimes the start of an outage. CloudConsole, a phone app for AWS, is built to show Latency and IntegrationLatency together on a phone so you can make that call quickly.
Did it start after a deploy? What changed? on the app’s alarm screen lists the deploys and configuration changes from the hour before the alarm fired.
About the app → · Download on the App Store