 CloudConsole
DynamoDB ReadThrottleEvents alarm for a GSI
This version of the read-throttle alarm watches a single global secondary index, using the TableName and GlobalSecondaryIndexName dimensions. AWS recommends alarming on the Sum when it is above your chosen threshold for 5 of 5 one-minute periods. Index read throttling only affects Query and Scan calls that target the index, not reads on the base table.
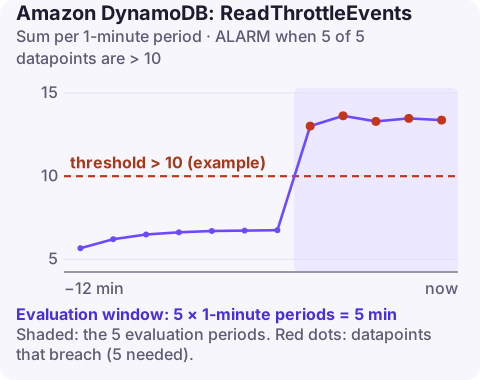
How GSI read throttling differs from table throttling
A global secondary index is stored and scaled separately from its table. On a provisioned table, every GSI has its own read capacity, its own auto scaling policy and its own partitions. Its read throttles are therefore reported under its own dimensions, and the table-level alarm will not see them.
| Table alarm | GSI alarm | |
|---|---|---|
| Dimensions | TableName | TableName, GlobalSecondaryIndexName |
| Affected calls | GetItem, Query, Scan on the table | Query and Scan with IndexName set |
| Typical cause | Table capacity, hot item | Index under-provisioned, low-cardinality index key |
Index keys are often chosen for query convenience, like status or country, and have far fewer distinct values than the table key. That concentrates reads on a few partitions, so GSIs develop hot partitions more readily than their tables.
Recommended alarm settings
| Setting | Value |
|---|---|
| Namespace | AWS/DynamoDB |
| Metric | ReadThrottleEvents |
| Dimensions | TableName, GlobalSecondaryIndexName |
| Statistic | Sum |
| Period | 60 seconds |
| Datapoints to alarm | 5 |
| Evaluation periods | 5 |
| Comparison operator | GreaterThanThreshold |
| Threshold | Depends on your situation: set per index from its history |
Per the CloudWatch recommended alarms list. You need one alarm per index you care about.
Choosing a threshold for an index
Look at the index on its own. Compare ReadThrottleEvents with ConsumedReadCapacityUnits for the same table and index over two weeks. A read-heavy index serving a dashboard may show predictable throttling when the dashboard refreshes; set the threshold just above that pattern, or better, give the index capacity for it. An index that rarely throttles can use a single-digit threshold. Use notBreaching for missing data.
If an index exists mainly for occasional admin lookups, consider whether it needs an alarm at all; throttling there may be acceptable, and the effort is better spent on the indexes behind user-facing screens.
Create it
# Example threshold of 10 per minute
aws cloudwatch put-metric-alarm \
  --alarm-name orders-by-status-read-throttles \
  --namespace AWS/DynamoDB \
  --metric-name ReadThrottleEvents \
  --dimensions Name=TableName,Value=orders Name=GlobalSecondaryIndexName,Value=status-index \
  --statistic Sum \
  --period 60 \
  --evaluation-periods 5 \
  --datapoints-to-alarm 5 \
  --threshold 10 \
  --comparison-operator GreaterThanThreshold \
  --treat-missing-data notBreaching \
  --alarm-actions arn:aws:sns:eu-west-2:123456789012:ops-alerts \
  --region eu-west-2
When it fires
- Check the index's capacity rather than the table's:
aws dynamodb describe-table --table-name orders \ --query "Table.GlobalSecondaryIndexes[?IndexName=='status-index'].ProvisionedThroughput" - Look for a hot index key. Contributor Insights can be enabled per index (add
--index-name status-indextoupdate-contributor-insights) to show which key values are throttled most. - Reduce expensive index reads. A
Scanon an index, or aQueryon a very popular key value with noLimit, reads far more than it returns. Narrow the key condition or add a sort-key condition. - Redesign low-cardinality keys with write sharding (appending a random suffix and querying the shards in parallel) if one value carries most of the traffic.
Questions
Does GSI read throttling affect the base table?
No. Only queries and scans against the index are throttled; reads on the table itself continue normally. Write throttling on a GSI is different and does affect the table.
Why is my GSI throttling when the table is not?
The index has its own capacity and partitions. It may be under-provisioned, or its partition key may have few distinct values, creating a hot partition.
Can I see which index keys are hot?
Yes. Enable CloudWatch Contributor Insights for the index to see the most accessed and most throttled keys.
Index throttling often hits one screen or report rather than the whole app, so users report it before metrics are checked. CloudConsole, a phone app for AWS, is built to show index-level alarms with the index's own capacity on a phone.
Did it start after a deploy? What changed? on the app’s alarm screen lists the deploys and configuration changes from the hour before the alarm fired.
About the app → · Download on the App Store