 CloudConsole
CloudWatch alarm for DynamoDB SuccessfulRequestLatency
SuccessfulRequestLatency is the time DynamoDB spends processing successful requests, measured on the service side, per TableName and Operation. AWS recommends alarming on its Average when it stays above a threshold you set for each operation, for 10 of 10 one-minute periods.
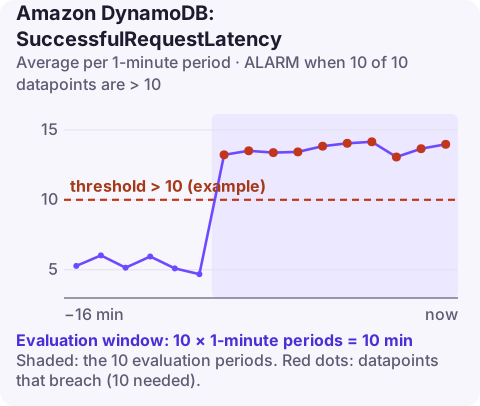
What it measures and what it leaves out
The metric starts when DynamoDB receives a request and stops when it has the response ready. It does not include network time between your application and DynamoDB, time spent in SDK retries, or requests that failed or were throttled. That boundary is the most useful thing about it:
| Your client sees | SuccessfulRequestLatency | Look at |
|---|---|---|
| Slow | High | Request shape: item size, page size, the operation |
| Slow | Normal | Client side: retries after throttling, new TCP/TLS connections per request, network path, DNS |
| Fast | High for one operation | A background job using that operation |
Point reads and writes (GetItem, PutItem, UpdateItem) are typically single-digit milliseconds on average. Query and Scan scale with how much data each call reads, up to the 1 MB page limit, so their normal is higher.
Recommended alarm settings
| Setting | Value |
|---|---|
| Namespace | AWS/DynamoDB |
| Metric | SuccessfulRequestLatency |
| Dimensions | TableName, Operation |
| Statistic | Average |
| Period | 60 seconds |
| Datapoints to alarm | 10 |
| Evaluation periods | 10 |
| Comparison operator | GreaterThanThreshold |
| Threshold | Depends on your situation: per operation, from history |
From the CloudWatch recommended alarms page. The Operation dimension takes values such as GetItem, Query or BatchWriteItem; create one alarm per operation that matters to you.
Setting a threshold per operation
- Chart the Average for each operation on the table over two weeks.
- Note the highest normal value for each (for example,
GetItempeaking at 4 ms,Queryat 18 ms). - Set each threshold to two or three times its normal peak: 10 ms for
GetItem, 50 ms forQueryin this example. - Skip operations you only use occasionally; with very few requests, averages are noisy.
Missing data: notBreaching. The ten-minute window ignores one slow minute, and because the statistic is an average, a few very slow requests among thousands will not trigger it; if the slowest requests matter to you, add a separate, looser alarm using the Maximum statistic.
Create it
# 10 ms is an example threshold for GetItem
aws cloudwatch put-metric-alarm \
  --alarm-name orders-getitem-latency \
  --namespace AWS/DynamoDB \
  --metric-name SuccessfulRequestLatency \
  --dimensions Name=TableName,Value=orders Name=Operation,Value=GetItem \
  --statistic Average \
  --period 60 \
  --evaluation-periods 10 \
  --datapoints-to-alarm 10 \
  --threshold 10 \
  --comparison-operator GreaterThanThreshold \
  --treat-missing-data notBreaching \
  --alarm-actions arn:aws:sns:eu-west-2:123456789012:ops-alerts \
  --region eu-west-2
When it fires
- Bigger items or pages? A deploy that started storing larger attributes, or a query that no longer uses a selective sort-key condition, makes each call do more work. Compare
ReturnedItemCountand consumed capacity per request. - Strongly consistent or transactional reads added to a hot path cost more than eventually consistent reads.
- Is it one Region-wide event? If several tables and operations rise together, check AWS Health for DynamoDB in the Region.
- AWS's latency troubleshooting guide also covers client settings such as connection reuse and SDK timeouts.
Questions
Does SuccessfulRequestLatency include network time?
No. It is measured inside DynamoDB, from receiving the request to producing the response, so client-side and network delays are not included.
What is normal DynamoDB latency?
Single-digit milliseconds on average for point operations such as GetItem and PutItem. Query and Scan depend on how much data each call reads.
Why is my app slow when SuccessfulRequestLatency is normal?
The delay is outside DynamoDB: throttling retries, connection setup, client timeouts or the network path.
Latency alarms are only actionable when you can see whether the database or the client is slow. CloudConsole, a phone app for AWS, is built to show this alarm per operation on a phone, next to the application's own latency.
Did it start after a deploy? What changed? on the app’s alarm screen lists the deploys and configuration changes from the hour before the alarm fired.
About the app → · Download on the App Store