 CloudConsole
CloudWatch alarm for DynamoDB SystemErrors
SystemErrors counts requests to a table that failed with a server-side (HTTP 500-range) error from DynamoDB itself. AWS recommends alarming on its Sum per TableName when it stays above a threshold for 15 consecutive one-minute periods, so you hear about prolonged service issues rather than the occasional retried error.
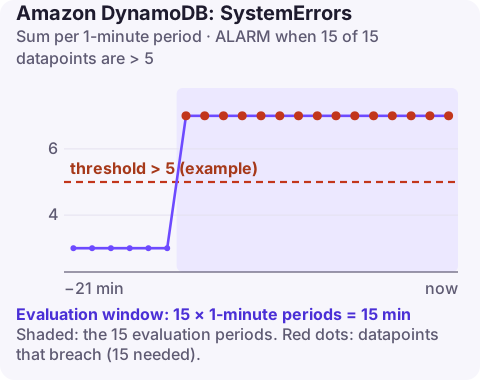
What SystemErrors means
Unlike throttling or validation errors, system errors are not caused by your request. DynamoDB returns InternalServerError (HTTP 500) or ServiceUnavailable (HTTP 503), and the AWS SDKs retry them automatically with backoff. A handful in a day is normal at scale and invisible to users. What matters is a sustained rate: that points to a problem on the service side, and the alarm helps you connect errors your application is logging with a DynamoDB issue rather than hunting through your own code.
Before relying on the alarm, run aws cloudwatch list-metrics --namespace AWS/DynamoDB --metric-name SystemErrors and check which dimension combinations your tables publish; the alarm's dimensions must match one of them exactly.
Recommended alarm settings
| Setting | Value |
|---|---|
| Namespace | AWS/DynamoDB |
| Metric | SystemErrors |
| Dimensions | TableName |
| Statistic | Sum |
| Period | 60 seconds |
| Datapoints to alarm | 15 |
| Evaluation periods | 15 |
| Comparison operator | GreaterThanThreshold |
| Threshold | Depends on your situation: above the background level your retries absorb |
From the CloudWatch recommended alarms list. The 15-minute window is deliberately long because a short burst of retried 500s has no lasting effect.
Choosing the threshold
Express it relative to traffic. If a table serves about 30,000 requests a minute, a sustained 30 system errors a minute is 0.1%, high enough that some requests are probably exhausting their retries. On a table serving 300 requests a minute, even 3 a minute is significant. Look at the last month: if SystemErrors is usually zero, a threshold between 1 and 5 is reasonable; if there is a steady trickle, set the threshold above it. Treat missing data as notBreaching.
Create it
# 5 errors/minute sustained for 15 minutes is an example
aws cloudwatch put-metric-alarm \
  --alarm-name orders-system-errors \
  --namespace AWS/DynamoDB \
  --metric-name SystemErrors \
  --dimensions Name=TableName,Value=orders \
  --statistic Sum \
  --period 60 \
  --evaluation-periods 15 \
  --datapoints-to-alarm 15 \
  --threshold 5 \
  --comparison-operator GreaterThanThreshold \
  --treat-missing-data notBreaching \
  --alarm-actions arn:aws:sns:eu-west-2:123456789012:ops-alerts \
  --region eu-west-2
When it fires
- Check AWS Health (your account's Health Dashboard and the public status page) for DynamoDB in the Region.
- Check whether it is one table or many. Errors across several tables at once suggest a regional issue; errors on one table only are worth raising with AWS Support, with request IDs from your logs.
- Make sure clients retry well. Default SDK retry settings handle short bursts; for a prolonged event, a circuit breaker stops retries from piling up and making things worse.
- Use other Regions if you have them. With global tables, shifting traffic to another replica is the main mitigation for a regional problem.
- The DynamoDB error handling page describes the 5xx errors and retry behaviour.
Questions
What causes DynamoDB SystemErrors?
Issues inside the DynamoDB service, surfaced as HTTP 500 InternalServerError or 503 ServiceUnavailable. They are not caused by the request itself.
Should I retry DynamoDB 500 errors?
Yes. The SDKs do it automatically with exponential backoff; most system errors succeed on retry.
Why does the SystemErrors alarm need 15 datapoints?
Occasional retried errors are normal. The long window means the alarm only fires for a prolonged problem.
A sustained service-side error rate is the kind of thing you want to confirm quickly, then communicate. CloudConsole, a phone app for AWS, is built to show this alarm and the affected tables on a phone.
Did it start after a deploy? What changed? on the app’s alarm screen lists the deploys and configuration changes from the hour before the alarm fired.
About the app → · Download on the App Store