 CloudConsole
CloudWatch alarm for DynamoDB UserErrors
UserErrors is the number of DynamoDB requests in the account and Region that failed with an HTTP 400 because the request itself was invalid. AWS recommends alarming on its Sum when it is above a threshold for 10 of 10 one-minute periods. It has no table dimension, so it tells you something is sending bad requests but not which table or caller.
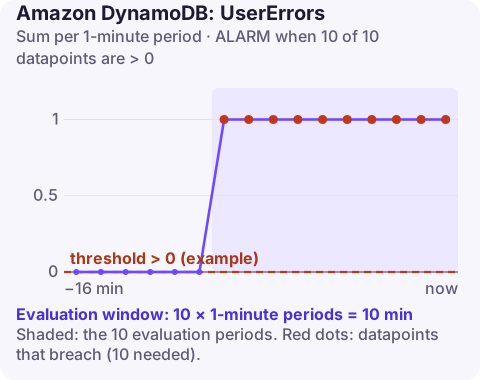
What counts as a user error
A user error is DynamoDB rejecting a request as the client's fault. Typical examples:
- ValidationException: key attributes missing or of the wrong type (key element does not match the schema), an item over the size limit, a malformed expression.
- ResourceNotFoundException: a table name typo, or a client configured for the wrong Region (ResourceNotFoundException).
- Query conditions that do not use the key, as in Query condition missed key schema element.
Failed conditional writes are reported separately in ConditionalCheckFailedRequests, so optimistic-locking conflicts do not flood this metric. The metric covers requests to both DynamoDB and DynamoDB Streams in the Region, across every table.
Recommended alarm settings
| Setting | Value |
|---|---|
| Namespace | AWS/DynamoDB |
| Metric | UserErrors |
| Dimensions | none (account and Region level) |
| Statistic | Sum |
| Period | 60 seconds |
| Datapoints to alarm | 10 |
| Evaluation periods | 10 |
| Comparison operator | GreaterThanThreshold |
| Threshold | Depends on your situation: 0 for any errors, or above a known background level |
From AWS's CloudWatch recommended alarms page.
Choosing the threshold
AWS offers two options: zero, to hear about any invalid request, or a higher value to ignore a small background. Which fits depends on what else uses DynamoDB in the account. In a single-application account, user errors should be close to zero, and zero is a good threshold. In a shared account, operational scripts, tests and tools often produce a steady trickle, for example checking whether a table exists by describing it. Chart a month of the metric, find that background, and set the threshold above it; the ten-minute window then catches a new bug that produces errors continuously. Treat missing data as notBreaching.
Create it
aws cloudwatch put-metric-alarm \
  --alarm-name ddb-user-errors-eu-west-2 \
  --namespace AWS/DynamoDB \
  --metric-name UserErrors \
  --statistic Sum \
  --period 60 \
  --evaluation-periods 10 \
  --datapoints-to-alarm 10 \
  --threshold 0 \
  --comparison-operator GreaterThanThreshold \
  --treat-missing-data notBreaching \
  --alarm-actions arn:aws:sns:eu-west-2:123456789012:ops-alerts \
  --region eu-west-2
Create one in each Region you use. To get table-level visibility as well, alarm on your application's own error logs, or count errorCode values per table from CloudTrail data events.
When it fires
- Line it up with deploys. A new release sending a malformed key or expression is the most common cause; errors start the minute it goes out.
- Read application logs for the exception name and message. They usually say exactly what was wrong, such as which attribute had the wrong type.
- If logs are unhelpful, and CloudTrail data events for DynamoDB are enabled, query them for events with an
errorCodeto get the table, operation and caller identity. - Check configuration. A wrong Region or table-name environment variable produces a constant stream of not-found errors.
Questions
Why does DynamoDB UserErrors have no dimensions?
It is reported per account and Region, aggregating 400 errors across all tables and DynamoDB Streams. Use application logs or CloudTrail to find the table.
Are ConditionalCheckFailedException errors counted in UserErrors?
No. Failed condition checks are reported in ConditionalCheckFailedRequests instead.
What threshold should I use for UserErrors?
Zero in an account dedicated to one application; otherwise just above the background level that tools and scripts generate.
User errors usually start with a deploy, so the person who can fix them is often already at work. CloudConsole, a phone app for AWS, is built to show the alarm and recent deployment timing on a phone so you can route it quickly.
Did it start after a deploy? What changed? on the app’s alarm screen lists the deploys and configuration changes from the hour before the alarm fired.
About the app → · Download on the App Store