 CloudConsole
CloudWatch alarm for DynamoDB ThrottledPutRecordCount
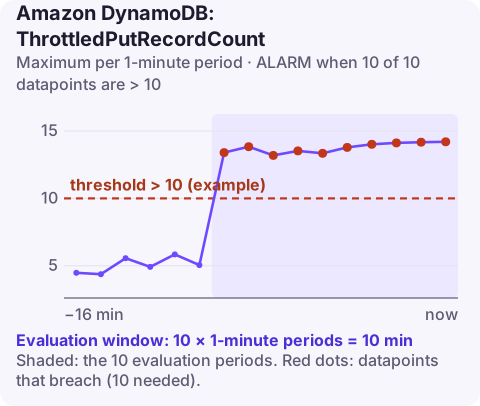
ThrottledPutRecordCount is the number of change records your Kinesis data stream throttled while DynamoDB was replicating a table's changes into it. AWS recommends alarming on its Maximum per TableName and DelegatedOperation above a threshold you set, for 10 of 10 one-minute periods; sustained throttling means the stream has too little capacity.
What the metric shows
Each Kinesis shard accepts a limited write rate (1 MB or 1,000 records per second per shard for provisioned streams). DynamoDB writes your table's changes into the stream, and when it pushes faster than the shards can take, Kinesis rejects part of each batch. DynamoDB retries those records, so nothing is lost, but every retry adds delay, which you will see in AgeOfOldestUnreplicatedRecord.
Patterns that cause it:
- the table's write rate grew but the stream's shard count was never revisited;
- a bulk load, backfill or TTL wave produces a burst of changes far above normal;
- other producers write to the same stream and use up its capacity;
- a hot shard: change records are keyed by the item's key, so a few very hot items concentrate writes on a small number of shards.
Recommended alarm settings
| Setting | Value |
|---|---|
| Namespace | AWS/DynamoDB |
| Metric | ThrottledPutRecordCount |
| Dimensions | TableName, DelegatedOperation |
| Statistic | Maximum |
| Period | 60 seconds |
| Datapoints to alarm | 10 |
| Evaluation periods | 10 |
| Comparison operator | GreaterThanThreshold |
| Threshold | Depends on your situation: just above the occasional throttling you accept |
Settings from AWS's recommended alarms list for DynamoDB.
Choosing a threshold
Some throttling during exceptional peaks is acceptable because DynamoDB retries. The aim is to catch regular throttling. Graph the metric for a few weeks and note its level during normal busy hours. If it is zero outside rare bursts, a threshold of a small number such as 10 will only fire when throttling persists for ten straight minutes. If it is already non-zero every day, the stream is undersized; fix the capacity before tuning the alarm around it.
Create it
# 10 is an example; verify DelegatedOperation with list-metrics
aws cloudwatch put-metric-alarm \
  --alarm-name orders-kinesis-throttled-puts \
  --namespace AWS/DynamoDB \
  --metric-name ThrottledPutRecordCount \
  --dimensions Name=TableName,Value=orders Name=DelegatedOperation,Value=PutRecords \
  --statistic Maximum \
  --period 60 \
  --evaluation-periods 10 \
  --datapoints-to-alarm 10 \
  --threshold 10 \
  --comparison-operator GreaterThanThreshold \
  --treat-missing-data notBreaching \
  --alarm-actions arn:aws:sns:eu-west-2:123456789012:ops-alerts \
  --region eu-west-2
When it fires
- Compare demand and capacity. Check the stream's
IncomingBytesandIncomingRecordsper shard and itsWriteProvisionedThroughputExceededmetric (see Kinesis WriteProvisionedThroughputExceeded). - Add capacity. For a provisioned stream, increase the shard count in proportion to the table's write throughput:
Or switch the stream to on-demand mode if traffic is unpredictable.aws kinesis update-shard-count --stream-name orders-changes \ --target-shard-count 8 --scaling-type UNIFORM_SCALING - Separate producers. If other applications share the stream, give DynamoDB replication its own stream.
- Plan bulk work. Throttle backfills and imports, or scale the stream up beforehand.
After resharding, the throttle count should fall within minutes and the replication age should drain back towards milliseconds as the retried records go through.
Questions
Does throttling lose DynamoDB change records?
No. DynamoDB retries throttled records. The cost is added replication delay, not data loss.
How many Kinesis shards do I need for DynamoDB replication?
Enough to absorb the table's peak change rate, in both records and bytes per second, with headroom. Size from the table's write throughput and average item size, or use on-demand mode.
Why does the alarm use the Maximum statistic?
It is AWS's recommendation; the alarm then reacts to the worst sample in each minute rather than an average that bursts could hide.
Stream throttling builds slowly, then turns into hours of lag. CloudConsole, a phone app for AWS, is built to show this alarm with the replication-lag trend so you can see whether it is catching up.
Did it start after a deploy? What changed? on the app’s alarm screen lists the deploys and configuration changes from the hour before the alarm fired.
About the app → · Download on the App Store