 CloudConsole
How to create a CloudWatch alarm for CPU utilization
In the CloudWatch console choose Create alarm, select the CPUUtilization metric for your instance (AWS/EC2, dimension InstanceId) or database (AWS/RDS, DBInstanceIdentifier), set a threshold such as 80% for 3 consecutive 5-minute periods, and attach an SNS topic for notifications. The CLI equivalent is aws cloudwatch put-metric-alarm with the same values.
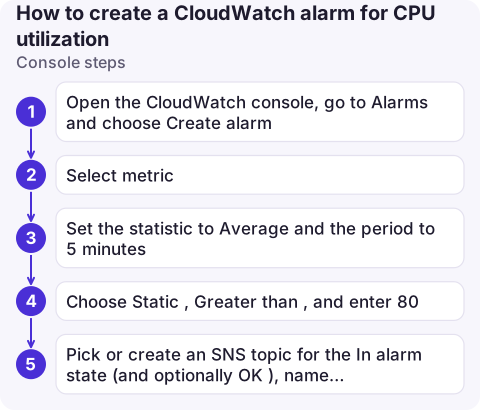
Console steps
- Open the CloudWatch console, go to Alarms and choose Create alarm.
- Select metric: for EC2 choose EC2 > Per-Instance Metrics and tick
CPUUtilizationfor your instance ID; for RDS choose RDS > Per-Database Metrics. - Set the statistic to Average and the period to 5 minutes.
- Choose Static, Greater than, and enter
80. Under additional configuration, set datapoints to alarm to 3 out of 3. - Pick or create an SNS topic for the In alarm state (and optionally OK), name the alarm and create it.
The EC2 console also offers a shortcut from the instance's monitoring tab, which pre-fills the dimension.
CLI: EC2 instance and RDS database
# EC2: average CPU above 80% for 15 minutes
aws cloudwatch put-metric-alarm \
  --alarm-name web-1-cpu-high \
  --namespace AWS/EC2 --metric-name CPUUtilization \
  --dimensions Name=InstanceId,Value=i-0123456789abcdef0 \
  --statistic Average --period 300 \
  --evaluation-periods 3 --datapoints-to-alarm 3 \
  --threshold 80 --comparison-operator GreaterThanThreshold \
  --treat-missing-data missing \
  --alarm-actions arn:aws:sns:eu-west-2:123456789012:ops-alerts \
  --ok-actions arn:aws:sns:eu-west-2:123456789012:ops-alerts

# RDS: same idea, different namespace and dimension
aws cloudwatch put-metric-alarm \
  --alarm-name orders-db-cpu-high \
  --namespace AWS/RDS --metric-name CPUUtilization \
  --dimensions Name=DBInstanceIdentifier,Value=orders-db \
  --statistic Average --period 300 \
  --evaluation-periods 3 --datapoints-to-alarm 3 \
  --threshold 80 --comparison-operator GreaterThanThreshold \
  --alarm-actions arn:aws:sns:eu-west-2:123456789012:ops-alerts
For a whole Auto Scaling group, use the dimension AutoScalingGroupName instead of InstanceId; the alarm then watches the group's average.
Choosing the numbers
| Setting | Starting point | Why |
|---|---|---|
| Threshold | 80% | Leaves headroom to react before saturation; lower for latency-sensitive services |
| Period | 300 s | Matches EC2 basic monitoring; use 60 s only with detailed monitoring enabled |
| Datapoints | 3 of 3 | Ignores short spikes from deploys and cron jobs |
| Missing data | missing | A stopped instance shouldn't page you; use breaching only if silence itself is a problem |
The published recommendations for these metrics are on EC2 CPUUtilization and RDS CPUUtilization.
Check it works
- The alarm should move from
INSUFFICIENT_DATAtoOKwithin a period or two. If it stays in insufficient data, the dimension value is wrong (typo in the instance ID, or a different Region). - Test the notification path without waiting for real load:
aws cloudwatch set-alarm-state --alarm-name web-1-cpu-high --state-value ALARM --state-reason "test". It returns to its real state on the next evaluation. - Confirm the SNS email subscription; unconfirmed subscriptions receive nothing.
Common mistakes
- Burstable instances (T family). CPU can look moderate while the instance is throttled after exhausting credits. Alarm on
CPUCreditBalanceas well. - Alarms on instances that Auto Scaling replaces. Per-instance alarms are orphaned when the instance is terminated; alarm on the group instead.
- Alerting on CPU alone for RDS. High CPU is often a symptom of a missing index or a connection storm; pair it with DatabaseConnections and DB load.
Questions
What is a good CPU utilization alarm threshold?
Around 80% average over 15 minutes is a sensible start for most services. Tune it after a couple of weeks of real data so it fires before users notice but not on routine peaks.
Why is my CPU alarm in INSUFFICIENT_DATA?
The metric has no data for that dimension: the instance ID or database name is wrong, the alarm is in another Region, or the instance is stopped.
Can one alarm watch CPU on several instances?
Use the AutoScalingGroupName dimension for instances in a group, or a metric math expression or Metrics Insights query to aggregate across instances.

A CPU alarm is only useful if you see it in time. CloudConsole, a phone app for AWS, is built to show alarms and the metric graph behind them on your phone.
About the app → · Download on the App Store