 CloudConsole
CloudWatch alarm for Amazon ECS service CPUUtilization
Service CPUUtilization is the CPU your service's tasks use as a percentage of the CPU their task definitions reserve. AWS recommends alarming on the Average for the ClusterName and ServiceName above 80% for 5 of 5 one-minute periods. Outside a deployment, sustained high values point to a bottleneck or a task definition that reserves too little CPU.
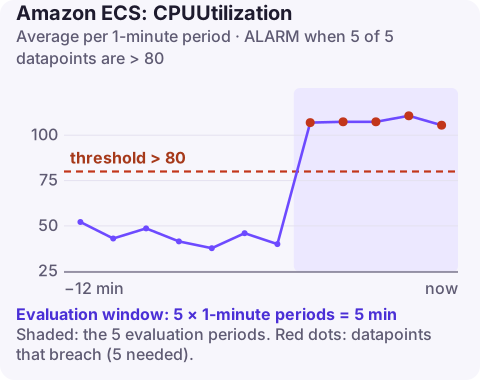
How the percentage is calculated
ECS adds up the CPU used by all tasks in the service and divides it by the CPU units those tasks reserve. On Fargate, a task cannot use more than its task-level CPU, so the metric tops out at 100%. On EC2, container CPU is a relative share, not a cap, unless you set a task-level limit; a container can borrow idle CPU from the instance and the service figure can exceed 100%.
So a reading of 140% on an EC2 service means the service is using more than it reserved. It works today because neighbours are idle, but those neighbours will be squeezed when they get busy, and placement decisions assume the smaller reservation.
Recommended alarm settings
| Setting | Value |
|---|---|
| Namespace | AWS/ECS |
| Metric | CPUUtilization |
| Dimensions | ClusterName, ServiceName |
| Statistic | Average |
| Period | 60 seconds |
| Datapoints to alarm | 5 |
| Evaluation periods | 5 |
| Comparison operator | GreaterThanThreshold |
| Threshold | 80.0 (percent) |
From the CloudWatch recommended alarms page; AWS suggests a threshold of about 80–85%.
Tuning
- Services with target tracking auto scaling on CPU (say, target 60%) should rarely reach 80% for five minutes. If they do, scaling is failing or capped at
maxCapacity; this alarm is your signal that it has run out of road. - Deployments can push CPU up briefly as new tasks warm caches or JIT-compile. Five breaching minutes absorbs most of that; for slow-starting JVM services, consider seven or eight.
- Bursty services on EC2 that legitimately run above their reservation should get a bigger reservation, not a higher threshold.
Create it
aws cloudwatch put-metric-alarm \
  --alarm-name prod-api-cpu-high \
  --namespace AWS/ECS \
  --metric-name CPUUtilization \
  --dimensions Name=ClusterName,Value=prod Name=ServiceName,Value=api \
  --statistic Average \
  --period 60 \
  --evaluation-periods 5 \
  --datapoints-to-alarm 5 \
  --threshold 80 \
  --comparison-operator GreaterThanThreshold \
  --alarm-actions arn:aws:sns:eu-west-2:123456789012:ops-alerts \
  --region eu-west-2
When it fires
- Is there a deployment in progress? Check
aws ecs describe-services --cluster prod --services api --query "services[0].deployments". High CPU that ends with the rollout may need no action. - Is load up? Compare with request counts on the load balancer. If traffic grew, scale out (how to scale an ECS service) and check the auto scaling maximum.
- Is one task hot? With Container Insights, per-task CPU shows whether a single task is stuck in a loop while others are idle; stop that task and let the service replace it.
- Profile if load is flat. A code change that made requests more expensive shows up as rising CPU per request.
- Update the task definition to reserve CPU that matches real use, so placement and scaling decisions are accurate.
Questions
Why is my ECS service CPU over 100%?
On EC2, containers without a hard CPU limit can use spare CPU on the instance, so usage can exceed the reserved amount. On Fargate, the metric stays at or below 100%.
Should I use CPUUtilization for ECS auto scaling?
It is the most common target tracking metric for ECS services. Keep this alarm as well, to catch cases where scaling has hit its maximum.
How do I see CPU per task?
Enable Container Insights on the cluster, which publishes task-level CPU metrics.
CPU alarms on a service are often a question of whether scaling is keeping up. CloudConsole, a phone app for AWS, is built to show this alarm with the service's task count and deployments on a phone.
Did it start after a deploy? What changed? on the app’s alarm screen lists the deploys and configuration changes from the hour before the alarm fired.
About the app → · Download on the App Store