 CloudConsole
CloudWatch alarm: ECS MemoryUtilization
Alarm on AWS/ECS MemoryUtilization per ClusterName and ServiceName using the Average over 60 seconds, firing when it is above 80 for 5 of 5 minutes. That tells you the service's tasks have used more than 80% of the memory reserved for them for five minutes straight, which is your cue to check for a leak or resize the task definition before containers are killed.
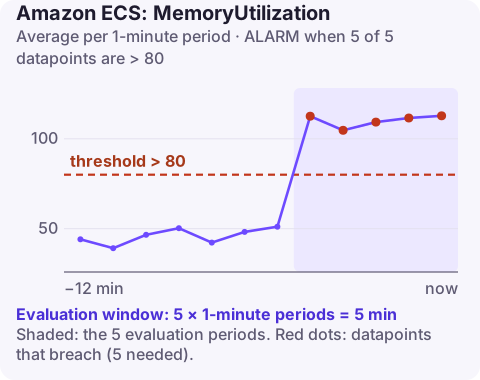
What the metric measures
For a service, MemoryUtilization is the memory its tasks are actually using, divided by the memory reserved for them in the task definition, as a percentage. ECS publishes it per cluster and service without Container Insights, every minute.
The denominator is the reservation, not the size of the host. That has two consequences:
- It can go above 100%. On the EC2 launch type, a container with only a soft limit (
memoryReservation) may use more than it reserved if the instance has spare memory. A reading of 130% is real, and it means your reservations are too small for the scheduler to place tasks safely. - On Fargate, 100% is the wall. Task memory is a hard limit there, so a service creeping towards 100% is heading for containers being stopped with OutOfMemoryError or exit code 137.
It is an average across the service's tasks. One task leaking memory while nine are healthy barely moves it; per-task detail needs Container Insights TaskMemoryUtilization.
Recommended alarm settings
| Setting | Recommended value |
|---|---|
| Namespace | AWS/ECS |
| Metric | MemoryUtilization |
| Dimensions | ClusterName, ServiceName |
| Statistic | Average |
| Threshold | 80 |
| Period | 60 seconds |
| Datapoints to alarm | 5 |
| Evaluation periods | 5 |
| Comparison operator | GreaterThanThreshold |
Why 80% for five minutes
Eighty per cent leaves room to act: a service at 80% of its reservation is not yet failing, but a traffic spike or a slow leak can take it the rest of the way. Five consecutive one-minute datapoints filter out the short bursts you see during a deploy, when new tasks warm caches and old ones drain.
Tune it from the service's own history rather than guessing:
- Chart the Average and Maximum of
MemoryUtilizationfor the last two weeks. - If the normal peak sits well below 80, keep 80. If the service legitimately runs at 75–85% (a JVM with a fixed heap, for example), either raise the task memory or move the threshold to just above the steady state, such as 90.
- If you regularly see values over 100% on EC2, fix the reservations first: set the task definition's memory close to what the service really uses, otherwise this alarm and the scheduler both work from wrong numbers.
Create the alarm
aws cloudwatch put-metric-alarm \
  --alarm-name ecs-prod-api-memory-high \
  --alarm-description "api service above 80% of reserved memory for 5 minutes" \
  --namespace AWS/ECS \
  --metric-name MemoryUtilization \
  --dimensions Name=ClusterName,Value=prod Name=ServiceName,Value=api \
  --statistic Average \
  --period 60 \
  --evaluation-periods 5 \
  --datapoints-to-alarm 5 \
  --threshold 80 \
  --comparison-operator GreaterThanThreshold \
  --alarm-actions arn:aws:sns:eu-west-2:123456789012:oncall-alerts
If the service uses Service Auto Scaling, a target tracking policy on ECSServiceAverageMemoryUtilization adds tasks before this alarm needs to fire. Keep the alarm anyway: scaling out does not fix a leak, it only multiplies it.
When it fires
- Is a deployment running? Check the service events with describe-services. A new task definition that suddenly uses more memory points at the release; roll back or raise its memory.
- Is it climbing in a straight line? Steady growth that only resets when tasks restart is a leak. Restarting buys time (force a new deployment), but the fix is in the code.
- Did it jump with traffic? If memory tracks request volume, add tasks (scale the service) or give each task more memory.
- Have tasks already been killed? List recently stopped tasks and read their stop reasons:
Then pass the ARNs toaws ecs list-tasks --cluster prod --service-name api --desired-status STOPPEDaws ecs describe-tasksand look for memory-related reasons.
Questions
What CloudWatch alarms should I set up for ECS?
At minimum, CPUUtilization and MemoryUtilization per service, plus RunningTaskCount from Container Insights so you know when a service has no tasks. Add load balancer or Service Connect error and latency alarms for services that take traffic.
Why is my ECS MemoryUtilization over 100%?
The metric divides usage by reserved memory. On EC2 with soft limits, containers can use more than they reserved, so values above 100% are possible and mean the reservation is too low.
Can this alarm detect ECS task failures?
Only indirectly, when tasks are failing because they run out of memory. For tasks that stop for other reasons, alarm on Container Insights RunningTaskCount instead.
A slow memory leak usually crosses 80% at an inconvenient hour, and the first question is whether a deploy just went out. CloudConsole, a phone app for AWS, is built to put the alarm, the service's recent events and its tasks on one phone screen.
Did it start after a deploy? What changed? on the app’s alarm screen lists the deploys and configuration changes from the hour before the alarm fired.
About the app → · Download on the App Store