 CloudConsole
ECS TaskCpuUtilization alarm for one service
This variant adds the ServiceName dimension, so it fires when the average task in one service uses more than 80% of its reserved CPU for 5 of 5 one-minute periods. Use it for the services you care about; the cluster-level alarm only shows that something somewhere is busy.
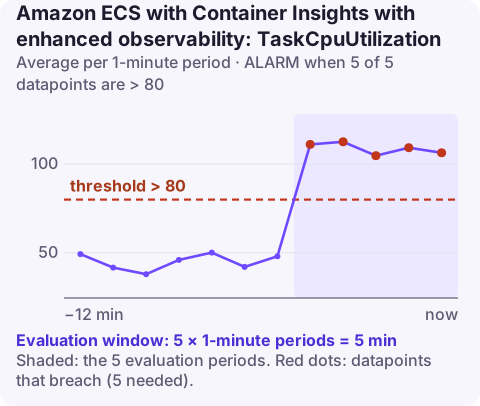
Service-level task CPU versus the other CPU metrics
ECS has three overlapping ways to look at a service's CPU. Knowing which is which saves confusion when they disagree:
| Metric | Namespace | Needs | Notes |
|---|---|---|---|
CPUUtilization | AWS/ECS | Nothing | Service total used / total reserved; on EC2 can exceed 100% |
TaskCpuUtilization (cluster) | ECS/ContainerInsights | Enhanced observability | All tasks in the cluster averaged |
TaskCpuUtilization (service) | ECS/ContainerInsights | Enhanced observability | Tasks of one service averaged; this page |
The practical advantage of the Container Insights version is that you can drill from it to individual tasks in the console, which matters when one task is stuck in a hot loop and the others are idle. It also keeps working the same way on Fargate and EC2, so one alarm definition fits services on either launch type.
Recommended alarm settings
| Setting | Value |
|---|---|
| Namespace | ECS/ContainerInsights |
| Metric | TaskCpuUtilization |
| Dimensions | ClusterName, ServiceName |
| Statistic | Average |
| Period | 60 seconds |
| Datapoints to alarm | 5 |
| Evaluation periods | 5 |
| Comparison operator | GreaterThanThreshold |
| Threshold | 80.0 (percent) |
As published on the CloudWatch recommended alarms page; compare the cluster-level alarm, which drops the service dimension.
Tuning per service
Set the threshold from the service's behaviour, not a house rule. Check two weeks of the Average and Maximum: a web API whose tasks peak at 55% can alarm at 75% and catch problems early; a CPU-heavy image processor that runs at 85% by design should alarm at 95% or watch its queue instead. If the service uses CPU target tracking, make sure the alarm threshold sits clearly above the scaling target, so the alarm means "scaling is not keeping up" rather than "scaling is about to happen".
Create it
aws cloudwatch put-metric-alarm \
  --alarm-name prod-api-task-cpu \
  --namespace ECS/ContainerInsights \
  --metric-name TaskCpuUtilization \
  --dimensions Name=ClusterName,Value=prod Name=ServiceName,Value=api \
  --statistic Average \
  --period 60 \
  --evaluation-periods 5 \
  --datapoints-to-alarm 5 \
  --threshold 80 \
  --comparison-operator GreaterThanThreshold \
  --alarm-actions arn:aws:sns:eu-west-2:123456789012:ops-alerts \
  --region eu-west-2
When it fires
- All tasks or one? Compare Average and Maximum. If Maximum is at 100% while Average is modest, one task is the problem: stop it with stop-task and let the service replace it, after grabbing a thread dump if you can.
- All tasks busy: check request volume and whether auto scaling is at its maximum; scale out if needed (scale an ECS service).
- Load flat but CPU up: look at the latest deployment; a regression in hot code paths is the likely cause.
- Persistently high after scaling: raise task CPU in the task definition.
Remember that on Fargate the CPU and memory sizes come in fixed combinations, so a bigger CPU allocation may also mean paying for more memory; check whether the extra cost is better spent on more tasks instead.
Questions
Why use TaskCpuUtilization instead of ECS CPUUtilization?
Both work for alarms. The Container Insights metric comes with task-level detail in the console, which helps find a single hot task.
What threshold should I use for task CPU?
AWS suggests 80%. Adjust it per service from its normal peak, keeping it above any auto scaling target.
Does TaskCpuUtilization work on Fargate?
Yes. Enhanced observability publishes task metrics for both Fargate and EC2 launch types.
When one service is running hot, the question is whether to scale or roll back. CloudConsole, a phone app for AWS, is built to show this alarm with the service's task count and last deployment on a phone.
Did it start after a deploy? What changed? on the app’s alarm screen lists the deploys and configuration changes from the hour before the alarm fired.
About the app → · Download on the App Store