 CloudConsole
CloudWatch alarm for Amazon ECS EBSFilesystemUtilization
EBSFilesystemUtilization is how full the file systems on EBS volumes attached to a service's ECS tasks are, as a percentage. AWS recommends alarming on the Average for ClusterName and ServiceName above 80% for 5 of 5 one-minute periods. A full volume makes writes fail and often brings the container down.
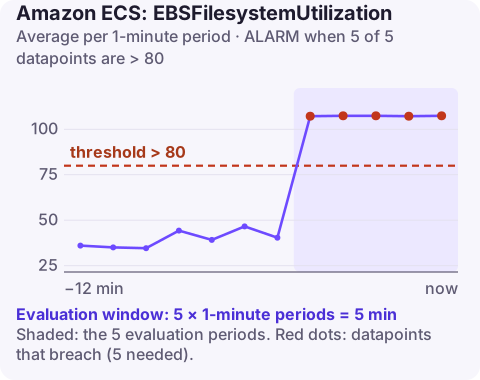
What the metric covers
ECS can create and attach an EBS volume to each task at launch, configured in the service's volume configuration rather than on a host. This metric reports how much of those volumes' file systems is used, averaged across the service's tasks. It is only published for services that use ECS-managed EBS volumes; bind mounts and Fargate ephemeral storage have their own metrics.
What fills these volumes depends on how you use them:
- Active data (a database, a queue spool, a build cache): growth is expected, and high utilisation means the application will soon fail writes.
- Volumes created from a snapshot with reference data: a high percentage may simply mean the volume is sized to fit, and nothing will grow.
- Logs or temp files written to the volume and never rotated: a slow, steady climb.
Recommended alarm settings
| Setting | Value |
|---|---|
| Namespace | AWS/ECS |
| Metric | EBSFilesystemUtilization |
| Dimensions | ClusterName, ServiceName |
| Statistic | Average |
| Period | 60 seconds |
| Datapoints to alarm | 5 |
| Evaluation periods | 5 |
| Comparison operator | GreaterThanThreshold |
| Threshold | 80.0 (percent) |
As given in AWS's recommended alarms list for ECS.
Tuning
For a snapshot-based, read-only volume, either raise the threshold close to the volume's steady value or skip the alarm. For data volumes, base the threshold on growth rate: if usage grows by 2% a day, 80% leaves about ten days to react, which is comfortable; if it can grow 10% in an hour during a batch job, alarm lower. Because the metric is an average across tasks, a single task with a full volume can hide among healthy ones; Container Insights reports task-level EBS metrics (see task EBS file system utilisation) if you need that granularity.
Create it
aws cloudwatch put-metric-alarm \
  --alarm-name prod-ingest-ebs-usage \
  --namespace AWS/ECS \
  --metric-name EBSFilesystemUtilization \
  --dimensions Name=ClusterName,Value=prod Name=ServiceName,Value=ingest \
  --statistic Average \
  --period 60 \
  --evaluation-periods 5 \
  --datapoints-to-alarm 5 \
  --threshold 80 \
  --comparison-operator GreaterThanThreshold \
  --alarm-actions arn:aws:sns:eu-west-2:123456789012:ops-alerts \
  --region eu-west-2
When it fires
- Find what is using the space. Open a shell in a task with ECS Exec and run
du -xh /data | sort -h | tailon the mount path. - Clean up what should not be there: rotated logs, temp files, old cache entries. Add retention to the application so it does not recur.
- Increase the size for new tasks. Update the service's volume configuration with a larger
sizeInGiB; tasks launched afterwards get the new size, and a forced deployment replaces the existing ones (force new deployment). - Check the impact. Stopped tasks with write errors show up as exits in the service events; see essential container exited.
Questions
Can I resize the EBS volume of a running ECS task?
Not in place through ECS. Change the volume size in the service configuration and deploy, so new tasks get larger volumes.
Does EBSFilesystemUtilization cover Fargate ephemeral storage?
No. It covers EBS volumes that ECS attaches to tasks. Fargate ephemeral storage has separate Container Insights metrics.
Why is my snapshot-based volume always at 95%?
Volumes created from a snapshot are often sized to fit the data. If the task does not write to it, high utilisation is expected.
Disks fill up gradually, then fail all at once. CloudConsole, a phone app for AWS, is built to show this alarm with its growth trend on a phone so you can tell whether it is urgent.
Did it start after a deploy? What changed? on the app’s alarm screen lists the deploys and configuration changes from the hour before the alarm fired.
About the app → · Download on the App Store