 CloudConsole
CloudWatch alarm for ECS ContainerCpuUtilization (cluster level)
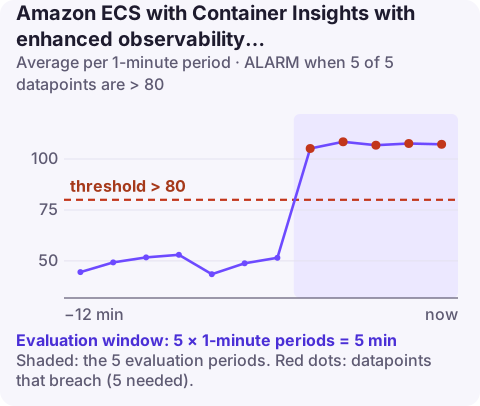
ContainerCpuUtilization is each container's CPU use divided by the CPU reserved for it (ContainerCpuUtilized / ContainerCpuReserved), from Container Insights enhanced observability. The cluster-level alarm averages it over all containers (ClusterName) and fires above 80% for 5 of 5 one-minute periods.
Container-level versus task-level CPU
A task can hold several containers: the application, a log router, a proxy, a metrics agent. TaskCpuUtilization looks at the task as a whole; ContainerCpuUtilization looks at each container against its own share. That distinction matters when a sidecar is the one struggling. A FireLens log router at 100% of a small CPU share will start dropping or delaying logs while the task total looks healthy.
Because the metric is a ratio against reserved CPU, check how your container definitions set cpu. If a container has no CPU value of its own, look at what ContainerCpuReserved reports for it before trusting the percentage.
Recommended alarm settings
| Setting | Value |
|---|---|
| Namespace | ECS/ContainerInsights |
| Metric | ContainerCpuUtilization |
| Dimensions | ClusterName |
| Statistic | Average |
| Period | 60 seconds |
| Datapoints to alarm | 5 |
| Evaluation periods | 5 |
| Comparison operator | GreaterThanThreshold |
| Threshold | 80.0 (percent) |
From AWS's CloudWatch recommended alarms list. Enable enhanced observability first:
aws ecs update-cluster-settings --cluster prod \
  --settings name=containerInsights,value=enhanced
Tuning
A cluster-wide average across every container is a blunt instrument: sidecars that idle at 2% pull it down, so an 80% average implies that many application containers are much hotter than that. Treat a breach as significant. If the average is dominated by a few large services, the per-service and per-container alarm (ContainerCPUUtilization by container name) is a better tool, and this one can stay as a broad backstop. Keep five breaching minutes to absorb startup spikes during deployments, when many containers initialise at once and briefly use far more CPU than in steady state.
Create it
aws cloudwatch put-metric-alarm \
  --alarm-name prod-cluster-container-cpu \
  --namespace ECS/ContainerInsights \
  --metric-name ContainerCpuUtilization \
  --dimensions Name=ClusterName,Value=prod \
  --statistic Average \
  --period 60 \
  --evaluation-periods 5 \
  --datapoints-to-alarm 5 \
  --threshold 80 \
  --comparison-operator GreaterThanThreshold \
  --alarm-actions arn:aws:sns:eu-west-2:123456789012:ops-alerts \
  --region eu-west-2
When it fires
- Find the containers. In the Container Insights console, switch to the container view and sort by CPU utilisation; note whether the hot containers are applications or sidecars.
- Application containers: check traffic and recent deployments, then scale out or give the container a larger CPU share.
- Sidecars: a log router or proxy that is CPU-starved needs a bigger
cpuvalue in its container definition; its share is often left at a token amount. - Everything at once: look for a cluster-wide event such as a traffic surge or a retry storm against a slow dependency.
Once the immediate pressure is off, review CPU shares across the task definitions involved. Teams often size the application container carefully and copy a minimal value for every sidecar; giving the sidecars realistic shares, based on what they use at peak, prevents the same alarm at the next busy period.
Questions
How is ContainerCpuUtilization calculated?
It is ContainerCpuUtilized divided by ContainerCpuReserved for each container, expressed as a percentage.
Why is a sidecar container at 100% CPU?
Sidecars such as log routers are often given a tiny CPU share. Under heavy logging they use all of it; increase their cpu value in the task definition.
Does this metric need enhanced observability?
Yes. Container-level metrics are part of Container Insights with enhanced observability.
Container-level alarms often point to a sidecar nobody is watching. CloudConsole, a phone app for AWS, is built to show which containers are hot when this alarm fires, on a phone.
Did it start after a deploy? What changed? on the app’s alarm screen lists the deploys and configuration changes from the hour before the alarm fired.
About the app → · Download on the App Store