 CloudConsole
CloudWatch alarm: ECS Container Insights ContainerMemoryUtilization (per container, per service)
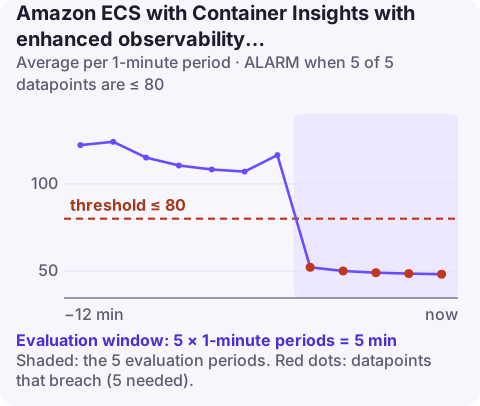
Alarm on ECS/ContainerInsights ContainerMemoryUtilization with the ContainerName, ClusterName and ServiceName dimensions, using the Average over 60 seconds and a threshold of 80% for 5 of 5 minutes. This version targets one named container inside one service, so it catches a sidecar or app container heading for its memory limit long before a cluster-wide average would move.
What this metric measures
ContainerMemoryUtilization is one of the container-level metrics that ECS publishes only when the cluster has Container Insights with enhanced observability switched on. It reports how much of its memory allowance a container is using, as a percentage. With the three dimensions on this page, CloudWatch averages that figure across every running copy of one container name (say api or envoy) in one service.
Why it matters: when a container hits its hard memory limit, ECS stops it and the task shows exit code 137 or OutOfMemoryError: Container killed due to memory usage. An alarm at 80% gives you a window to act before that happens.
How this differs from the cluster-level version. The cluster-wide ContainerMemoryUtilization alarm uses only ClusterName, so one leaking container in a busy cluster barely moves it. Use the cluster alarm as a cheap catch-all; use this per-service, per-container alarm for the services you page on, and for containers with tight limits such as log routers and proxies.
Recommended alarm settings
| Setting | Recommended value |
|---|---|
| Namespace | ECS/ContainerInsights |
| Metric | ContainerMemoryUtilization |
| Dimensions | ContainerName, ClusterName, ServiceName |
| Statistic | Average |
| Threshold | 80.0 |
| Period | 60 seconds |
| Datapoints to alarm | 5 |
| Evaluation periods | 5 |
| Comparison operator | LessThanOrEqualToThreshold (as published; see the note below) |
Operator gotcha. AWS's published table lists LessThanOrEqualToThreshold for this entry, while the stated intent (and the cluster-level entry) is to catch high memory. Taken literally, an alarm built that way sits in ALARM whenever usage is at or below 80%, which is most of the time. The example below uses GreaterThanThreshold so it fires on high usage; keep the other values as published.
Why these settings and how to tune them
- Five consecutive minutes above 80%. Memory rarely spikes and recovers the way CPU does, so five minutes is enough to ignore a short garbage-collection peak while still giving you time before the limit.
- Pick the threshold from history. Chart the metric with the Maximum statistic over two weeks. JVM and Node.js services often settle at a steady high plateau because the runtime grows its heap up to a configured size; if a container idles at 85% by design, set the threshold a few points above its normal ceiling rather than at 80%.
- Average hides one bad task. If one task leaks while nine are healthy, the average stays low. For leak-prone services, add a second alarm using
Maximum, or alarm on restarts instead. - Missing data. When the service scales to zero there is no data;
notBreachingkeeps the alarm quiet in that case.
Create the alarm
Container Insights must be in enhanced mode on the cluster first:
aws ecs update-cluster-settings \
  --cluster prod-cluster \
  --settings name=containerInsights,value=enhanced
Then create the alarm (published settings, with the operator corrected as explained above):
aws cloudwatch put-metric-alarm \
  --alarm-name ecs-prod-orders-api-container-memory \
  --alarm-description "orders/api container memory above 80% for 5 minutes" \
  --namespace ECS/ContainerInsights \
  --metric-name ContainerMemoryUtilization \
  --dimensions Name=ContainerName,Value=api Name=ClusterName,Value=prod-cluster Name=ServiceName,Value=orders \
  --statistic Average \
  --period 60 \
  --evaluation-periods 5 \
  --datapoints-to-alarm 5 \
  --threshold 80 \
  --comparison-operator GreaterThanThreshold \
  --treat-missing-data notBreaching \
  --alarm-actions arn:aws:sns:eu-west-2:123456789012:oncall-alerts
Container names are case-sensitive and must match the name in the task definition exactly. More flag detail is on put-metric-alarm.
When it fires
- Check whether tasks are already dying. Run
aws ecs describe-servicesand look at recent events, thenaws ecs list-tasks --desired-status STOPPEDand check the stopped reason; see OutOfMemoryError and exit code 137. - Correlate with a deploy. A step change right after a new task definition revision points at code or a dependency upgrade; a slow climb since the last restart points at a leak or an unbounded cache.
- Buy time safely. A rolling restart (force a new deployment) resets leaking containers; raising the container's memory limit in a new revision stops the kills. Neither fixes a leak.
- Fix the cause. Cap runtime heaps below the container limit (for example JVM
-XX:MaxRAMPercentage), bound in-process caches, and check whether a sidecar's buffers grow with traffic.
Questions
Can a CloudWatch alarm detect ECS task failure?
Not directly from this metric. Memory alarms warn you before a container is killed; to catch tasks that have already stopped, alarm on RunningTaskCount from Container Insights or react to ECS task state change events in EventBridge.
Which CloudWatch alarms should I set for ECS?
A sensible minimum is CPU and memory utilisation per service, running task count, and load balancer 5xx errors and response time. Per-container alarms like this one are worth adding for services with sidecars or tight memory limits.
Does this metric exist without enhanced observability?
No. Container-level metrics such as ContainerMemoryUtilization are only published when Container Insights runs in enhanced mode; standard Container Insights stops at task and service level.
Memory alarms on a single container tend to trip overnight, when a slow leak finally crosses the line. CloudConsole, an AWS phone app, is built to put that alarm, the service events and the stopped-task reasons in front of you without opening a laptop.
Did it start after a deploy? What changed? on the app’s alarm screen lists the deploys and configuration changes from the hour before the alarm fired.
About the app → · Download on the App Store