 CloudConsole
CloudWatch alarm for ECS TaskCpuUtilization (cluster level)
With Container Insights enhanced observability, TaskCpuUtilization reports how much of their reserved CPU tasks are using. The cluster-level alarm uses the ClusterName dimension and fires when the Average is above 80% for 5 of 5 one-minute periods. It is a broad health signal for the whole cluster; use the service-level version to find the culprit.
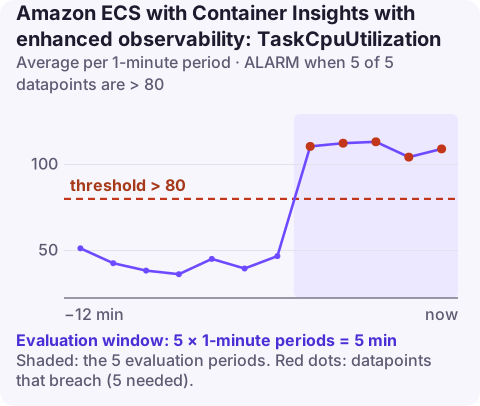
What a cluster-wide task CPU average tells you
Each task's CPU use is divided by the CPU that task reserves, then averaged across every task in the cluster. A high value means tasks in general are running close to their CPU allocation: the cluster's workloads are under-sized, or a busy period is pushing everything hard at once.
Being an average over every task, it has blind spots. One service at 100% among twenty idle ones barely moves it. It is most useful in clusters that run one main application, or as an early warning that a shared event (a traffic surge, a slow shared dependency causing retries) is affecting everything. Pair it with the per-service TaskCpuUtilization alarm.
Recommended alarm settings
| Setting | Value |
|---|---|
| Namespace | ECS/ContainerInsights |
| Metric | TaskCpuUtilization |
| Dimensions | ClusterName |
| Statistic | Average |
| Period | 60 seconds |
| Datapoints to alarm | 5 |
| Evaluation periods | 5 |
| Comparison operator | GreaterThanThreshold |
| Threshold | 80.0 (percent) |
From the CloudWatch recommended alarms list. Task-level metrics such as this one come from enhanced observability, which you turn on per cluster (extra CloudWatch charges apply):
aws ecs update-cluster-settings --cluster prod \
  --settings name=containerInsights,value=enhanced
Tuning
80% is sensible for clusters of latency-sensitive services. For clusters of batch workers that are meant to saturate their CPU, raise the threshold to 90% or more, or skip the alarm and watch queue depth instead. If the cluster average sits high every day at the same hour and nobody is affected, it is a sizing note rather than an incident; adjust task CPU or scaling, then keep the threshold. The five-minute window ignores short spikes from deployments starting many tasks at once.
Create it
aws cloudwatch put-metric-alarm \
  --alarm-name prod-cluster-task-cpu \
  --namespace ECS/ContainerInsights \
  --metric-name TaskCpuUtilization \
  --dimensions Name=ClusterName,Value=prod \
  --statistic Average \
  --period 60 \
  --evaluation-periods 5 \
  --datapoints-to-alarm 5 \
  --threshold 80 \
  --comparison-operator GreaterThanThreshold \
  --alarm-actions arn:aws:sns:eu-west-2:123456789012:ops-alerts \
  --region eu-west-2
When it fires
- Find the services driving it. In the Container Insights console, sort services by task CPU, or query the per-service metric for the last hour.
- Look for a shared cause. If many services rose together, check traffic at the load balancer and any shared dependency that may be causing retries.
- Check auto scaling. Services pinned at their
maxCapacitycannot add tasks; raise the maximum or the task CPU. - Right-size tasks whose reservation is simply too small for their normal load (register a new task definition with more CPU).
On EC2-backed clusters, also check the instances themselves: if tasks are busy because the hosts are oversubscribed, adding instances helps more than changing task definitions.
Questions
What is TaskCpuUtilization in ECS Container Insights?
The percentage of a task's reserved CPU that it is using. At cluster level, it is averaged across all tasks.
How do I get task-level metrics in ECS?
Enable Container Insights with enhanced observability on the cluster, using update-cluster-settings with containerInsights set to enhanced.
Is a cluster-level task CPU alarm enough?
Rarely on its own. A single busy service can hide in the average, so add per-service alarms for important services.
A cluster-wide CPU alarm is a prompt to find which service is responsible. CloudConsole, a phone app for AWS, is built to show the alarm and the busiest services in that cluster on a phone.
Did it start after a deploy? What changed? on the app’s alarm screen lists the deploys and configuration changes from the hour before the alarm fired.
About the app → · Download on the App Store