 CloudConsole
CloudWatch alarm for ECS ContainerMemoryUtilization (cluster level)
ContainerMemoryUtilization reports how much of its reserved memory each container is using, from Container Insights enhanced observability. The cluster-level alarm averages it across all containers (ClusterName) and fires above 80% for 5 of 5 one-minute periods, warning you before containers start hitting their memory limits.
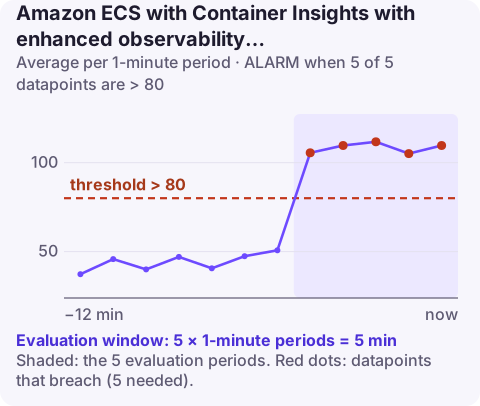
Why memory is measured per container
Memory limits in ECS can be set per container, and the kernel enforces them per container. A task with plenty of total memory can still lose its application container if that one container has a hard memory limit and exceeds it. The task stops with exit code 137 and an OutOfMemoryError reason that names the container.
Sidecars are frequent victims: a log router given 64 MiB because that was the example value can be killed during a burst of log volume. This metric watches containers against their own reservations, which is the level where those kills happen. At cluster scope it is a general warning; to protect a particular service, add alarms with service and container dimensions as well.
Recommended alarm settings
| Setting | Value |
|---|---|
| Namespace | ECS/ContainerInsights |
| Metric | ContainerMemoryUtilization |
| Dimensions | ClusterName |
| Statistic | Average |
| Period | 60 seconds |
| Datapoints to alarm | 5 |
| Evaluation periods | 5 |
| Comparison operator | GreaterThanThreshold |
| Threshold | 80.0 (percent) |
As listed in AWS's recommended alarms reference.
Tuning
Containers with only a soft memoryReservation can legitimately go above 100% on EC2 hosts with spare memory, which inflates the average. Containers with a fixed heap, such as JVMs, sit high all the time. Before settling on 80%, chart the metric for a week and look at the spread. If a few heavy services dominate, scope alarms to them and leave this one as a backstop. If containers were OOM-killed in the past, note the utilisation level shortly before each kill and set the threshold comfortably below it.
Create it
# Enhanced observability is required for container-level metrics
aws ecs update-cluster-settings --cluster prod \
  --settings name=containerInsights,value=enhanced
aws cloudwatch put-metric-alarm \
--alarm-name prod-cluster-container-memory \
--namespace ECS/ContainerInsights \
--metric-name ContainerMemoryUtilization \
--dimensions Name=ClusterName,Value=prod \
--statistic Average \
--period 60 \
--evaluation-periods 5 \
--datapoints-to-alarm 5 \
--threshold 80 \
--comparison-operator GreaterThanThreshold \
--alarm-actions arn:aws:sns:eu-west-2:123456789012:ops-alerts \
--region eu-west-2When it fires
- Look for OOM-killed containers in recently stopped tasks:
aws ecs describe-tasks --cluster prod --tasks <task-arn> --query "tasks[0].containers[].[name,exitCode,reason]". - Find the heaviest containers in the Container Insights container view, and check whether they are applications or sidecars.
- Raise limits where justified: increase the container's
memoryin the task definition, and the task memory on Fargate. - Chase leaks: a container whose memory climbs steadily until restart needs a heap profile, not more memory.
- See essential container exited for how a killed container stops the whole task.
A non-essential sidecar that is killed does not stop the task, so its OOM kills can go unnoticed for weeks; this alarm and the container's restart history are often the only evidence.
Questions
What is the difference between task and container memory utilisation?
Task utilisation compares the whole task's memory use with the task reservation. Container utilisation compares each container with its own reservation, which is where per-container limits are enforced.
Can container memory utilisation exceed 100%?
Yes, on EC2, for a container with only a soft memory reservation and spare memory on the host. With a hard limit, the container is killed instead.
How do I know which container was OOM-killed?
Describe the stopped task; each container shows its exit code and reason, and 137 with an OutOfMemoryError reason marks the killed one.
OOM kills tend to arrive as a flurry of task restarts, which is hard to read from a notification alone. CloudConsole, a phone app for AWS, is built to show the alarm with the stopped containers and their exit codes on a phone.
Did it start after a deploy? What changed? on the app’s alarm screen lists the deploys and configuration changes from the hour before the alarm fired.
About the app → · Download on the App Store