 CloudConsole
ECS ContainerCPUUtilization alarm by container name
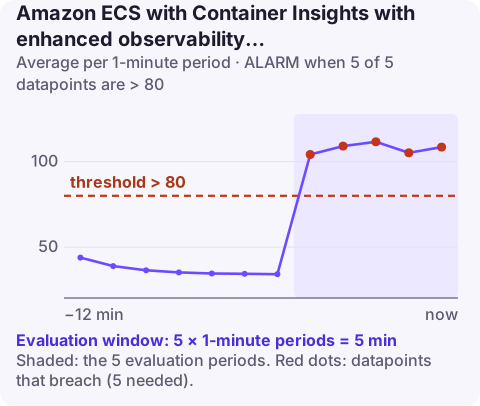
This alarm targets one named container inside one service, using the ContainerName, ClusterName and ServiceName dimensions, and fires when its Average CPU utilisation is above 80% for 5 of 5 one-minute periods. AWS's table spells the metric ContainerCPUUtilization; CloudWatch metric names are case-sensitive, so confirm the exact spelling your cluster publishes.
Why alarm on a single container
The cluster-level container CPU alarm averages every container in the cluster, and the service task CPU alarm averages whole tasks. Neither separates the application from its sidecars. This alarm does: give the app container of the api service its own threshold, and if you need it, a different one for the log_router container.
Typical uses:
- the main application container of a latency-sensitive service;
- a proxy or Service Connect/App Mesh sidecar whose saturation slows every request;
- a log router that falls behind under bursts of log volume.
Recommended alarm settings
| Setting | Value |
|---|---|
| Namespace | ECS/ContainerInsights |
| Metric | ContainerCPUUtilization |
| Dimensions | ContainerName, ClusterName, ServiceName |
| Statistic | Average |
| Period | 60 seconds |
| Datapoints to alarm | 5 |
| Evaluation periods | 5 |
| Comparison operator | GreaterThanThreshold |
| Threshold | 80.0 (percent) |
From the CloudWatch recommended alarms page. The cluster-level alarm in the same table uses ContainerCpuUtilization; an alarm whose metric name differs from the published one by case only receives no data. Check first:
aws cloudwatch list-metrics --namespace ECS/ContainerInsights \
  --dimensions Name=ClusterName,Value=prod Name=ServiceName,Value=api Name=ContainerName,Value=app \
  --query "Metrics[].MetricName" --output text | tr '\t' '\n' | grep -i cpu
Create it
# Use the metric name exactly as list-metrics returns it
aws cloudwatch put-metric-alarm \
  --alarm-name prod-api-app-container-cpu \
  --namespace ECS/ContainerInsights \
  --metric-name ContainerCPUUtilization \
  --dimensions Name=ContainerName,Value=app Name=ClusterName,Value=prod Name=ServiceName,Value=api \
  --statistic Average \
  --period 60 \
  --evaluation-periods 5 \
  --datapoints-to-alarm 5 \
  --threshold 80 \
  --comparison-operator GreaterThanThreshold \
  --alarm-actions arn:aws:sns:eu-west-2:123456789012:ops-alerts \
  --region eu-west-2
ContainerName is the name field from the container definition, not the image name.
Tuning
Each container gets the threshold that suits its role. For the application container, start at 80% and adjust from two weeks of history so the alarm sits above the normal busy-hour peak. For sidecars, alarm higher (90%) but treat a breach seriously, since a saturated proxy or log router affects everything in the task. Keep the five-minute window for application containers that spike while warming up after a deploy.
When it fires
- Application container hot: check the request rate and whether auto scaling is at its maximum; scale out or give the container more CPU.
- Sidecar hot: raise its
cpuvalue in the task definition and redeploy; for log routers, also look at what started logging heavily. - Single task: if only one task's container is hot, stop that task and let the service replace it after capturing diagnostics.
- Look at the latest deployment for a change in that container's image.
Because this alarm is tied to a container name, renaming the container in a new task definition silently stops its data. Include the alarm in the same template or pipeline as the task definition so they change together.
Questions
Is it ContainerCpuUtilization or ContainerCPUUtilization?
AWS's recommended-alarm table uses both spellings. Metric names are case-sensitive, so use whatever list-metrics returns for your cluster.
What value goes in the ContainerName dimension?
The name of the container in the task definition, such as app or log_router, not the image name.
Why alarm on a sidecar container?
A CPU-starved proxy or log router slows or drops work for the whole task even when the application container is fine.
When a single container is the bottleneck, knowing its name saves a lot of digging. CloudConsole, a phone app for AWS, is built to show container-level alarms on a phone with the service they belong to.
Did it start after a deploy? What changed? on the app’s alarm screen lists the deploys and configuration changes from the hour before the alarm fired.
About the app → · Download on the App Store