 CloudConsole
CloudWatch alarm for ECS EphemeralStorageUtilized (Fargate)
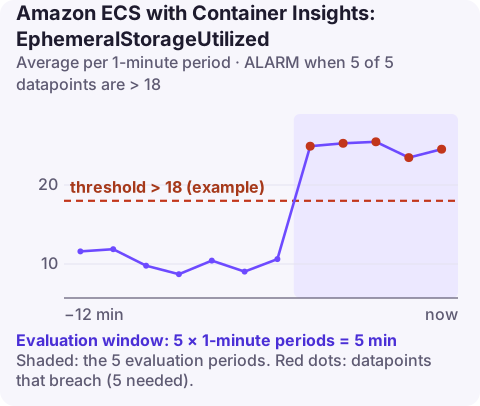
EphemeralStorageUtilized is how much of a Fargate task's ephemeral storage is in use, in gigabytes, published by Container Insights per ClusterName and ServiceName. AWS recommends alarming on the Average above a threshold you set, about 90% of the storage size, for 5 of 5 one-minute periods. A full ephemeral disk makes writes fail and usually crashes the container.
What Fargate ephemeral storage is
Every Fargate task gets a scratch disk shared by its containers: image layers, the writable container layer, and any bind-mount volumes defined in the task. By default it is 20 GiB, and you can raise it per task definition with ephemeralStorage.sizeInGiB (up to 200 GiB). It disappears when the task stops.
The metric is an absolute amount, not a percentage, so the threshold must be converted from the size you configured. Container Insights also publishes EphemeralStorageReserved, which you can divide into EphemeralStorageUtilized with metric math if you prefer a percentage alarm.
Things that fill it: application logs written to files instead of stdout, temporary downloads or uploads that are never deleted, local caches with no size cap, and very large container images.
Recommended alarm settings
| Setting | Value |
|---|---|
| Namespace | ECS/ContainerInsights |
| Metric | EphemeralStorageUtilized |
| Dimensions | ClusterName, ServiceName |
| Statistic | Average |
| Period | 60 seconds |
| Datapoints to alarm | 5 |
| Evaluation periods | 5 |
| Comparison operator | GreaterThanThreshold |
| Threshold | Depends on your situation: about 90% of the configured ephemeral storage |
From the CloudWatch recommended alarms list. Container Insights must be enabled on the cluster for the metric to exist.
Working out the threshold
| Ephemeral storage | 90% threshold (GB) |
|---|---|
| 20 GiB (default) | 18 |
| 50 GiB | 45 |
| 100 GiB | 90 |
Image layers count against the space from the start, so a task with a 4 GB image begins at 4 GB used. If a service legitimately runs close to full (a cache that fills to a fixed size), alarm a little above its steady level rather than at 90%. Because the metric is averaged across the service's tasks, a single task filling its disk can be masked; the per-task metric is covered in task ephemeral storage utilisation.
Create it
# 18 GB = 90% of the default 20 GiB ephemeral storage
aws cloudwatch put-metric-alarm \
  --alarm-name prod-worker-ephemeral-storage \
  --namespace ECS/ContainerInsights \
  --metric-name EphemeralStorageUtilized \
  --dimensions Name=ClusterName,Value=prod Name=ServiceName,Value=worker \
  --statistic Average \
  --period 60 \
  --evaluation-periods 5 \
  --datapoints-to-alarm 5 \
  --threshold 18 \
  --comparison-operator GreaterThanThreshold \
  --alarm-actions arn:aws:sns:eu-west-2:123456789012:ops-alerts \
  --region eu-west-2
When it fires
- See what is on the disk. Use ECS Exec and run
df -handdu -xh / 2>/dev/null | sort -h | tail -20. - Send logs to stdout so the awslogs or FireLens driver ships them, rather than writing log files inside the container.
- Clean up temp files in the code path that creates them, and cap local caches.
- Increase the size by registering a task definition with a larger
ephemeralStorageand updating the service. - Check for recently stopped tasks with disk-related errors; see essential container exited.
Questions
How much ephemeral storage does a Fargate task get?
20 GiB by default. You can configure up to 200 GiB in the task definition with ephemeralStorage.sizeInGiB.
Is EphemeralStorageUtilized a percentage?
No, it is in gigabytes. Convert your percentage target to GB using the configured size, or divide by EphemeralStorageReserved with metric math.
Do container images count against ephemeral storage?
Yes. The image layers are stored on the task's ephemeral storage, so large images reduce the space left for your data.
A full task disk tends to show up as crash-looping tasks rather than a clear error. CloudConsole, a phone app for AWS, is built to show this alarm with the service's stopped tasks on a phone so the link is obvious.
Did it start after a deploy? What changed? on the app’s alarm screen lists the deploys and configuration changes from the hour before the alarm fired.
About the app → · Download on the App Store