 CloudConsole
CloudWatch alarm: ECS TaskEphemeralStorageUtilization (cluster level)
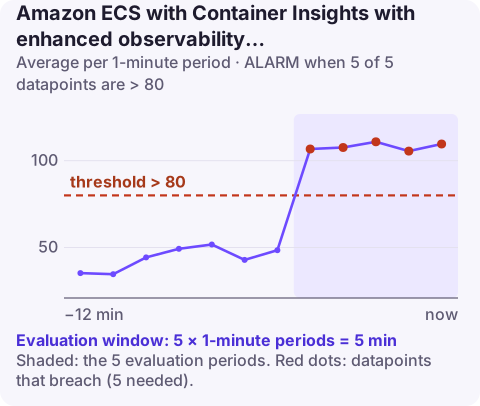
Create an alarm on ECS/ContainerInsights TaskEphemeralStorageUtilization with only the ClusterName dimension, Average statistic, 60-second period, and a threshold of 80 breached in 5 of 5 periods. It is a broad early warning that tasks across the cluster are using most of their ephemeral storage; pair it with per-service alarms to find which workload is responsible.
What ephemeral storage is, and what this alarm sees
On Fargate, every task gets a scratch disk for container image layers, writable container layers and any bind mounts that are not EFS or EBS. By default it is 20 GiB, and you can raise it in the task definition with ephemeralStorage.sizeInGiB (up to 200 GiB at the time of writing). When it fills, writes to the container's file system fail and the application usually crashes or hangs.
TaskEphemeralStorageUtilization expresses usage as a percentage of that reservation. This page covers the variant with only ClusterName, which averages across every task in the cluster that reports the metric. That makes it a cluster health signal rather than a pointer to one service.
Recommended alarm settings
| Setting | Recommended value |
|---|---|
| Namespace | ECS/ContainerInsights |
| Metric | TaskEphemeralStorageUtilization |
| Dimensions | ClusterName |
| Statistic | Average |
| Threshold | 80.0 |
| Period | 60 seconds |
| Datapoints to alarm | 5 |
| Evaluation periods | 5 |
| Comparison operator | GreaterThanThreshold |
Cluster level or service level?
A cluster average moves only when many tasks fill up together, for example after a shared base image grows or a common library starts writing large temporary files. It will not fire if one small service fills its disk while forty others sit at 10%.
| Alarm | Dimensions | Use it for |
|---|---|---|
| This one | ClusterName | One cheap alarm per cluster; catches platform-wide changes |
| Per-service version | ClusterName, ServiceName | Services that write to local disk: media processing, unpacking archives, local caches |
If the cluster is dominated by one large service, the two alarms behave almost the same; in a shared cluster they diverge a lot.
Tuning and creating the alarm
- Large image layers count against the reservation from the moment the task starts, so a task can sit at 40% before doing any work. Look at a week of history and make sure 80% is comfortably above the normal level.
- Because averaging dilutes a single hot service, some teams lower the cluster threshold to 60–70% and rely on per-service alarms for precision.
- Treat missing data as not breaching, so an empty cluster does not alarm.
aws cloudwatch put-metric-alarm \
  --alarm-name ecs-prod-cluster-ephemeral-storage-80 \
  --alarm-description "Average task ephemeral storage across prod-cluster above 80%" \
  --namespace ECS/ContainerInsights \
  --metric-name TaskEphemeralStorageUtilization \
  --dimensions Name=ClusterName,Value=prod-cluster \
  --statistic Average \
  --period 60 \
  --evaluation-periods 5 \
  --datapoints-to-alarm 5 \
  --threshold 80 \
  --comparison-operator GreaterThanThreshold \
  --treat-missing-data notBreaching \
  --alarm-actions arn:aws:sns:eu-west-2:123456789012:oncall-alerts
When it fires
- Find the services driving it. In the CloudWatch console, search the
ECS/ContainerInsightsnamespace for the same metric byClusterName, ServiceNameand sort by current value. - Check for a common change: a new base image, a logging agent writing to disk, or a dependency that started caching downloads locally.
- Inspect a task with ECS Exec and
du -shon/tmpand the application's working directories. - Fix: clean up temporary files in code, log to stdout instead of files, shrink images, or raise
sizeInGiBin a new task definition revision and deploy it.
Questions
What CloudWatch alarms should I set for ECS?
Cover CPU and memory per service, running task count, and storage for services that write to disk. A cluster-wide ephemeral storage alarm like this one is a low-cost extra that catches platform-wide changes.
Will a full ephemeral disk show up as an ECS task failure?
Usually yes, indirectly: the application fails on write and the essential container exits. The stopped reason then shows a non-zero exit code rather than an explicit disk-full message, which is why the alarm is worth having.
How much ephemeral storage does a Fargate task get?
By default 20 GiB. You can configure more per task definition; check the current maximum in the Fargate task storage documentation.
A cluster-wide storage alarm rarely needs an immediate fix, but you do want to know which service caused it before it spreads. CloudConsole is a phone app built to show CloudWatch alarms and ECS service details side by side.
Did it start after a deploy? What changed? on the app’s alarm screen lists the deploys and configuration changes from the hour before the alarm fired.
About the app → · Download on the App Store