 CloudConsole
CloudWatch alarm for ECS TaskMemoryUtilization (cluster level)
TaskMemoryUtilization, from Container Insights enhanced observability, is the memory tasks use as a share of the memory they reserve. The cluster-level alarm averages it across all tasks (ClusterName) and fires above 80% for 5 of 5 one-minute periods, a sign that workloads in the cluster are generally close to their memory limits.
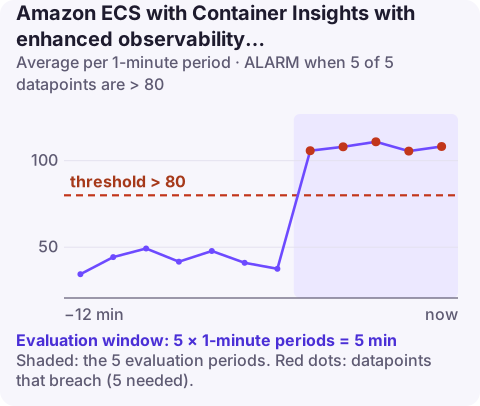
Why task memory deserves an alarm
Memory is the resource that ends tasks abruptly. A task at 100% of its CPU is slow; a container that exceeds its hard memory limit is killed by the kernel's out-of-memory handler, the task stops with exit code 137, and the service starts a replacement that may meet the same fate. Watching how close tasks run to their reservation gives you warning before that cycle starts.
Averaging over the whole cluster has a cost: a single memory-hungry service among many modest ones barely moves the figure. This alarm is best as a cluster health signal, for example when a shared library upgrade raised memory use across every service, or in clusters dedicated to one application. For individual services, use the service-level version.
Recommended alarm settings
| Setting | Value |
|---|---|
| Namespace | ECS/ContainerInsights |
| Metric | TaskMemoryUtilization |
| Dimensions | ClusterName |
| Statistic | Average |
| Period | 60 seconds |
| Datapoints to alarm | 5 |
| Evaluation periods | 5 |
| Comparison operator | GreaterThanThreshold |
| Threshold | 80.0 (percent) |
Settings from the CloudWatch recommended alarms page. Enhanced observability must be on for task-level metrics:
aws ecs update-cluster-settings --cluster prod \
  --settings name=containerInsights,value=enhanced
Tuning
Runtimes differ in how they use memory. JVM services with a fixed heap often sit at a steady 70–85% of the task's memory by design, while Node.js or Go services usually float lower and climb only under load. Look at the cluster average across a week, including deploys. If the normal level is already near 80%, alarming there will be noisy; either give tasks more memory headroom or set the threshold at the point where OOM kills have actually started in the past.
Create it
aws cloudwatch put-metric-alarm \
  --alarm-name prod-cluster-task-memory \
  --namespace ECS/ContainerInsights \
  --metric-name TaskMemoryUtilization \
  --dimensions Name=ClusterName,Value=prod \
  --statistic Average \
  --period 60 \
  --evaluation-periods 5 \
  --datapoints-to-alarm 5 \
  --threshold 80 \
  --comparison-operator GreaterThanThreshold \
  --alarm-actions arn:aws:sns:eu-west-2:123456789012:ops-alerts \
  --region eu-west-2
When it fires
- Check for OOM kills across the cluster: list recently stopped tasks and look for exit code 137 or an OutOfMemoryError stop reason.
aws ecs list-tasks --cluster prod --desired-status STOPPED --query "taskArns[:20]" - Find the services responsible in the Container Insights console by sorting services by memory utilisation.
- Distinguish leaks from load: memory that only ever rises between deploys is a leak; memory that follows traffic is load.
- Fix: raise task memory in the affected task definitions, scale out services under load, and profile the ones that leak.
If the rise is cluster-wide and began on a particular day, look for something every service shares: a base image update, a new version of an observability agent running as a sidecar, or a runtime upgrade that changed default heap sizing.
Questions
What does TaskMemoryUtilization measure?
The memory a task uses as a percentage of the memory it reserves. The cluster-level metric averages that across all tasks in the cluster.
What happens when an ECS task exceeds its memory?
The container that exceeds its hard limit is killed, usually with exit code 137, and the service replaces the task.
Do I need enhanced observability for this metric?
Yes. Task-level metrics like TaskMemoryUtilization come from Container Insights with enhanced observability.
Memory pressure often shows up as tasks restarting overnight. CloudConsole, a phone app for AWS, is built to show this alarm with recent OOM-killed tasks on a phone.
Did it start after a deploy? What changed? on the app’s alarm screen lists the deploys and configuration changes from the hour before the alarm fired.
About the app → · Download on the App Store