 CloudConsole
OutOfMemoryError: Container killed due to memory usage
The container used more memory than its hard limit, so the kernel killed it (exit code 137) and ECS recorded this reason. Find the limit that applied (the container's memory setting, or the task size on Fargate), compare it with real usage in Container Insights, then either raise the limit or reduce what the process holds. For JVM and Node.js apps, make sure the runtime's heap limit is set below the container limit.
Which limit was hit
aws ecs describe-tasks --cluster prod --tasks <task-arn> \
  --query 'tasks[0].{taskMemory: memory, containers: containers[].[name,exitCode,reason,memory]}'
Memory limits can sit at two levels:
| Setting | Effect |
|---|---|
Container memory | Hard limit. Exceed it and the container is killed |
Container memoryReservation | Soft limit used for placement. The container can use more if the instance or task has room |
Task-level memory | Required on Fargate. All containers in the task share it; a sidecar can push the task over |
On EC2 with only memoryReservation set, a container is limited by the instance's free memory rather than a fixed figure, so kills there can depend on what else runs on the host.
Look at real usage
The AWS/ECS MemoryUtilization metric is a service-wide average, which hides one task spiking. With Container Insights enabled, query per-task memory over time:
stats max(MemoryUtilized) as maxMiB, max(MemoryReserved) as limitMiB by TaskId
| filter Type = "Task" and ServiceName = "api"
| sort maxMiB desc
| limit 20
Run it against the /aws/ecs/containerinsights/prod/performance log group. A steady climb from start to kill suggests a leak; a sudden jump suggests one big request, file or query.
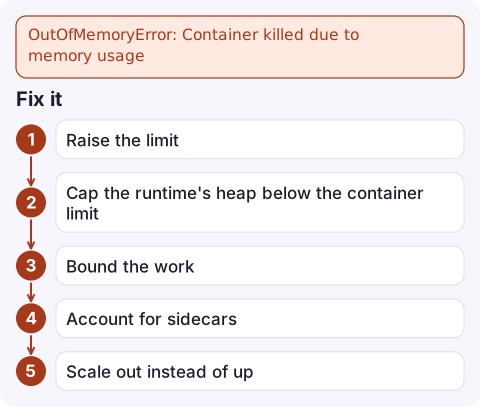
Fix it
- Raise the limit in a new task definition revision, then deploy it. On Fargate, pick a valid CPU and memory combination; memory options depend on the CPU size.
- Cap the runtime's heap below the container limit, leaving room for non-heap memory:
Without this, older JVMs and some Node.js versions size themselves from the host's memory, not the container's, and get killed instead of throwing a catchable out-of-memory error.JAVA_TOOL_OPTIONS=-XX:MaxRAMPercentage=75.0 NODE_OPTIONS=--max-old-space-size=1536 - Bound the work: stream large files, paginate queries, limit concurrency per task (worker threads, request concurrency), and cap in-memory caches.
- Account for sidecars on Fargate. Log routers and agents use memory from the same task allowance.
- Scale out instead of up if memory grows with load per task: more tasks with target tracking keeps each one below the limit.
Mistakes to avoid
- Doubling memory without looking at the trend. A leak just takes twice as long to kill the task, and you pay for the memory meanwhile.
- Reading the service-average metric only. One task can be killed repeatedly while the average looks fine.
- Setting the heap equal to the container limit. Threads, buffers and native libraries need memory outside the heap.
Questions
What does OutOfMemoryError: Container killed due to memory usage mean?
The container exceeded its hard memory limit and the kernel's OOM killer stopped it. ECS reports it with exit code 137.
What is the difference between memory and memoryReservation in ECS?
memory is a hard limit that kills the container when exceeded. memoryReservation is a soft limit used for placement; the container may use more if memory is available.
How do I monitor memory per ECS task?
Enable Container Insights and query MemoryUtilized per task in Logs Insights, or use its per-task metrics. The standard MemoryUtilization metric is an average across the service.

Memory kills often start under peak load, when tasks are replaced faster than they can serve traffic. CloudConsole, a phone app for AWS, is built to show memory alarms and stopped-task reasons on your phone so you can see the pattern as it starts.
Did it start after a deploy? What changed? on the app’s alarm screen lists the deploys and configuration changes from the hour before the alarm fired.
About the app → · Download on the App Store