 CloudConsole
ECS TaskMemoryUtilization alarm for one service
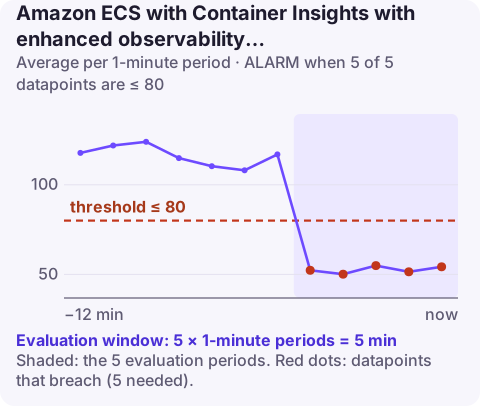
The per-service version of the task memory alarm uses the ClusterName and ServiceName dimensions with Average, 80, and 5 of 5 one-minute periods. AWS's table lists the comparison operator as LessThanOrEqualToThreshold, which fires when memory is low; to catch high memory use, as the alarm's description intends, you need GreaterThanThreshold.
What the per-service metric shows
For each service, Container Insights divides each task's memory use by its reserved memory and averages the result over the service's tasks. Unlike the cluster-wide alarm, it points straight at the service that is under memory pressure, which is usually what you need at 3am.
It is also more precise than the older AWS/ECS MemoryUtilization metric when you need to drill down: the Container Insights console lets you go from the service to individual tasks and containers.
Recommended alarm settings, as published
| Setting | Value |
|---|---|
| Namespace | ECS/ContainerInsights |
| Metric | TaskMemoryUtilization |
| Dimensions | ClusterName, ServiceName |
| Statistic | Average |
| Period | 60 seconds |
| Datapoints to alarm | 5 |
| Evaluation periods | 5 |
| Comparison operator | LessThanOrEqualToThreshold |
| Threshold | 80.0 (percent) |
Reproduced from the CloudWatch recommended alarms page. Note the operator: with LessThanOrEqualToThreshold and 80, the alarm is in ALARM whenever the service's tasks use 80% of their memory or less, which for a healthy service is nearly all the time. AWS's own description of this alarm is about detecting high memory use, and its cluster-level twin uses GreaterThanThreshold.
Create it
aws cloudwatch put-metric-alarm \
  --alarm-name prod-api-task-memory \
  --namespace ECS/ContainerInsights \
  --metric-name TaskMemoryUtilization \
  --dimensions Name=ClusterName,Value=prod Name=ServiceName,Value=api \
  --statistic Average \
  --period 60 \
  --evaluation-periods 5 \
  --datapoints-to-alarm 5 \
  --threshold 80 \
  --comparison-operator LessThanOrEqualToThreshold \
  --alarm-actions arn:aws:sns:eu-west-2:123456789012:ops-alerts \
  --region eu-west-2
The command above follows the published table. To alert on high memory, which is the usual goal, change one line:
--comparison-operator GreaterThanThreshold \A low-memory alarm can make sense in one niche case: detecting tasks that reserve far more memory than they use, so you can shrink them and save money. If that is your aim, route it to a ticket queue, not a pager.
Tuning the high-memory version
Set the threshold from the service's own history. Look at the Average and Maximum over two weeks. If the service normally runs at 60% and its tasks were OOM-killed at times when the average reached 90%, then 80% gives useful warning. For services with a fixed-size heap that always sit at 85%, alarm at 92–95% or alarm on OOM-related task stops instead. The Maximum statistic is worth a second alarm for services where one task can leak while the others stay healthy.
When it fires
- Check task stops: recent stops with exit code 137 confirm memory kills (exit code 137).
- Leak or load? Plot the metric over several days. A sawtooth that resets at each deploy is a leak.
- Short term: scale out to spread load, or force a new deployment to reset leaking tasks (force new deployment).
- Long term: raise task memory in the task definition, or fix the leak with a heap profile from a running task via ECS Exec.
Questions
Why is my ECS TaskMemoryUtilization alarm always in ALARM?
If it uses LessThanOrEqualToThreshold, as AWS's table lists, it fires whenever memory is at or below the threshold. Use GreaterThanThreshold to detect high memory.
Should I alarm on Average or Maximum task memory?
Average shows service-wide pressure; Maximum catches a single task close to its limit. Many teams use both.
What is the difference from the cluster-level alarm?
This one adds the ServiceName dimension, so it measures one service's tasks instead of every task in the cluster.
An alarm that is always red trains people to ignore it, so the operator matters. CloudConsole, a phone app for AWS, is built to show each alarm's state history on a phone, which makes a constantly firing alarm easy to spot.
Did it start after a deploy? What changed? on the app’s alarm screen lists the deploys and configuration changes from the hour before the alarm fired.
About the app → · Download on the App Store