 CloudConsole
CloudWatch alarm for Amazon ECS TargetResponseTime
This alarm watches TargetResponseTime in the AWS/ECS namespace for a ClusterName and ServiceName, firing when the Average stays above a threshold you set for 5 of 5 one-minute periods. It measures how long the service's tasks take to answer requests, so it catches slowness that error alarms miss.
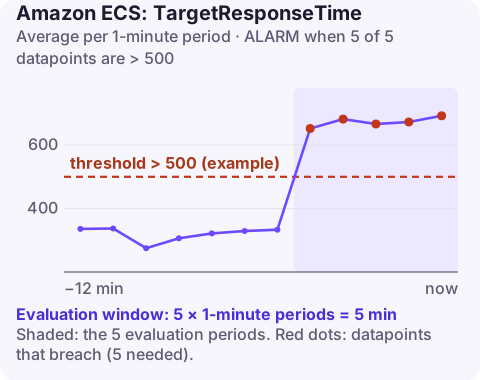
Where this metric comes from
Most people know TargetResponseTime from Application Load Balancers, where it lives in AWS/ApplicationELB with load balancer and target group dimensions. The alarm here uses the AWS/ECS namespace with cluster and service dimensions, which ECS publishes for services using Service Connect: the Service Connect proxy in each task measures how long the application takes to respond. Check that it exists for your service before creating the alarm:
aws cloudwatch list-metrics --namespace AWS/ECS --metric-name TargetResponseTime \
  --dimensions Name=ClusterName,Value=prod Name=ServiceName,Value=api
If nothing comes back, the service is not using Service Connect; alarm on the load balancer's TargetResponseTime for its target group instead. Check the metric's unit in the console before choosing a threshold.
Recommended alarm settings
| Setting | Value |
|---|---|
| Namespace | AWS/ECS |
| Metric | TargetResponseTime |
| Dimensions | ClusterName, ServiceName |
| Statistic | Average |
| Period | 60 seconds |
| Datapoints to alarm | 5 |
| Evaluation periods | 5 |
| Comparison operator | GreaterThanThreshold |
| Threshold | Depends on your situation: based on your service's requirements and history |
From the CloudWatch recommended alarms page.
Choosing a threshold
- Graph the Average over two weeks and note the normal busy-hour level.
- Decide what response time callers can tolerate. For an internal API called inside a user request, that is often a few hundred milliseconds; for a batch endpoint it may be seconds.
- Set the threshold between the two, nearer the tolerance. Twice the normal busy-hour average is a reasonable first try.
Averages hide slow tails. If a minority of requests are very slow, the average may not move; consider a second alarm on a high percentile if the metric supports it in your console.
Create it
# 500 assumes milliseconds; confirm the unit for your service first
aws cloudwatch put-metric-alarm \
  --alarm-name prod-api-response-time \
  --namespace AWS/ECS \
  --metric-name TargetResponseTime \
  --dimensions Name=ClusterName,Value=prod Name=ServiceName,Value=api \
  --statistic Average \
  --period 60 \
  --evaluation-periods 5 \
  --datapoints-to-alarm 5 \
  --threshold 500 \
  --comparison-operator GreaterThanThreshold \
  --alarm-actions arn:aws:sns:eu-west-2:123456789012:ops-alerts \
  --region eu-west-2
When it fires
- Check the service's CPU and memory (service CPUUtilization). A saturated service answers slowly before it errors.
- Check its dependencies. Most response-time regressions come from a database, cache or downstream service; look at their latency alarms for the same window.
- Look for a deploy. A new task definition that coincides with the slowdown is the first suspect; roll back if needed.
- Is one task slow? Health-check failures or high CPU on a single task (Container Insights) suggest stopping that task.
- Scale out if the service is busy and healthy; see scaling an ECS service.
If the slowdown is limited to calls from one client service, compare that client's view (its own outbound latency) with this metric; a gap between them points at the network path rather than the tasks.
Questions
Is ECS TargetResponseTime the same as the ALB metric?
They measure similar things, but this one is in the AWS/ECS namespace with cluster and service dimensions, published for services using Service Connect. The ALB metric is in AWS/ApplicationELB.
Why can't I find TargetResponseTime for my ECS service?
The service probably does not use Service Connect. Use the load balancer target group's TargetResponseTime instead.
What threshold should I use?
There is no universal value. Start around twice your normal busy-hour average and keep it below what callers can tolerate.
A slow service is often reported by users before an alarm. CloudConsole, a phone app for AWS, is built to show this alarm with the service's CPU and recent deployments together on a phone.
Did it start after a deploy? What changed? on the app’s alarm screen lists the deploys and configuration changes from the hour before the alarm fired.
About the app → · Download on the App Store