 CloudConsole
CloudWatch alarm: Lambda Insights memory_utilization
Alarm on LambdaInsights memory_utilization per function_name using the Average over 60 seconds, firing when it is above 90 for 10 of 10 minutes. It warns you that a function has been using more than 90% of its configured memory for ten minutes, before invocations start failing because they run out.
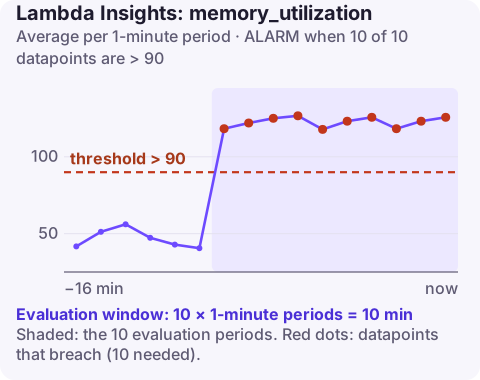
What the metric measures
memory_utilization is the memory a function used during an invocation, as a percentage of the memory you configured for it. The standard AWS/Lambda namespace has no memory metric at all; this one comes from Lambda Insights and lands in the LambdaInsights namespace. To get it, a function needs two things:
- the Lambda Insights extension added as a layer (the ARN is specific to your Region and architecture; take it from the Lambda Insights documentation);
- the
CloudWatchLambdaInsightsExecutionRolePolicymanaged policy, or equivalent permissions, on the function's execution role.
Lambda Insights adds CloudWatch metric and log charges for each function you enable it on, so turn it on for the functions where memory matters rather than everywhere.
Without Lambda Insights you can still see peak memory per invocation in the Max Memory Used field of each REPORT log line; this Logs Insights query summarises it. That is fine for investigation but awkward to alarm on.
Recommended alarm settings
| Setting | Recommended value |
|---|---|
| Namespace | LambdaInsights |
| Metric | memory_utilization |
| Dimensions | function_name |
| Statistic | Average |
| Threshold | 90 |
| Period | 60 seconds |
| Datapoints to alarm | 10 |
| Evaluation periods | 10 |
| Comparison operator | GreaterThanThreshold |
Why 90%, and when to go lower
When an invocation needs more memory than the function has, Lambda stops it and the invocation fails, often with signal: killed in the logs. Alerting at an average of 90% across ten minutes tells you the function is living close to that edge, not just that one invocation was heavy.
The average hides outliers, which matters for functions whose input size varies. Use the history to decide:
- Chart
memory_utilizationfor the function over two weeks, with both Average and Maximum. - If the Maximum regularly sits much higher than the Average (a 40 MB file one minute, a 400 MB file the next), lower the threshold to something like 75 or 80, so the alarm fires while the largest inputs still fit.
- If the line is flat and well below 90, keep 90. The ten-minute window already ignores a brief burst.
Create the alarm
aws cloudwatch put-metric-alarm \
  --alarm-name lambda-image-resizer-memory-high \
  --alarm-description "image-resizer averaging over 90% of its memory for 10 minutes" \
  --namespace LambdaInsights \
  --metric-name memory_utilization \
  --dimensions Name=function_name,Value=image-resizer \
  --statistic Average \
  --period 60 \
  --evaluation-periods 10 \
  --datapoints-to-alarm 10 \
  --threshold 90 \
  --comparison-operator GreaterThanThreshold \
  --alarm-actions arn:aws:sns:eu-west-2:123456789012:oncall-alerts
Note the lower-case function_name dimension: Lambda Insights does not use the FunctionName spelling of AWS/Lambda, and an alarm with the wrong case never receives data.
When it fires
- Check for failures already happening. Look at the function's Errors and search the log group for
Runtime.ExitErrororsignal: killedin the same window. - Decide between growth and a leak. If usage rises over the life of each execution environment and falls after a cold start, something is kept in memory between invocations: a module-level cache, a list that is appended to, clients created per request and never closed.
- Give it room now. Raising memory is quick and also raises the CPU share:
Measure the cost and duration effect of different sizes; profiling tools built for Lambda can try several settings for you.aws lambda update-function-configuration \ --function-name image-resizer \ --memory-size 1024 - Then fix the cause: stream large objects instead of loading them whole, bound in-memory caches, and pool database connections (RDS Proxy is the usual route for relational databases) instead of opening new ones in every invocation.
Questions
How do I monitor Lambda memory usage in CloudWatch?
Enable Lambda Insights on the function to get memory_utilization and related metrics in the LambdaInsights namespace. Without it, read Max Memory Used from the REPORT lines in the function's logs.
Does increasing Lambda memory cost more?
The price per millisecond rises with memory, but more memory also gives more CPU, so many functions finish faster. Measure duration at a couple of sizes before deciding.
Why is memory_utilization missing for my function?
The Lambda Insights layer is not attached, the execution role lacks permission to write its data, or the function has not been invoked since you enabled it.
Memory alarms on Lambda usually mean a quick memory bump now and a code fix later. CloudConsole, a phone app for AWS, is built to show the alarm and the function's recent invocations on your phone with production guardrails.
Did it start after a deploy? What changed? on the app’s alarm screen lists the deploys and configuration changes from the hour before the alarm fired.
About the app → · Download on the App Store