 CloudConsole
CloudWatch alarm: Aurora AuroraBinlogReplicaLag (error state)
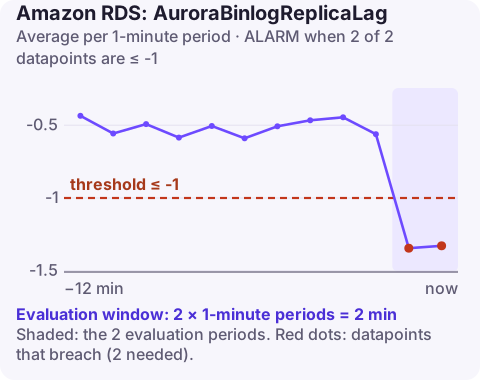
Alarm on AWS/RDS AuroraBinlogReplicaLag for DBClusterIdentifier with Role=WRITER, Average over 60 seconds, firing when it is less than or equal to -1 for 2 of 2 minutes. Aurora MySQL reports -1 when binlog replication into the cluster is in an error state, so this alarm detects replication that has stopped, not replication that is slow.
What the metric and the -1 value mean
An Aurora MySQL cluster can act as a binary log replica of another MySQL source: another Aurora cluster (often in another Region), RDS for MySQL, or a self-managed server. On the cluster's writer, AuroraBinlogReplicaLag reports how many seconds that replication trails the source.
When replication breaks, the metric reports -1 instead of a lag. Typical causes: a duplicate key or missing row error when applying an event (often because someone wrote directly to the replica), the source purging binary logs the replica still needs, network or credential changes between the two, and DDL that fails on the replica.
This alarm deliberately targets only the error state. If you also care about delay, add a separate alarm on the same metric with GreaterThanThreshold and a lag tolerance.
Recommended alarm settings
| Setting | Recommended value |
|---|---|
| Namespace | AWS/RDS |
| Metric | AuroraBinlogReplicaLag |
| Dimensions | DBClusterIdentifier, Role=WRITER |
| Statistic | Average |
| Threshold | -1.0 |
| Period | 60 seconds |
| Datapoints to alarm | 2 |
| Evaluation periods | 2 |
| Comparison operator | LessThanOrEqualToThreshold |
The Role=WRITER dimension follows whichever instance is currently the writer, so the alarm survives failovers.
Tuning the window
Two one-minute datapoints with the Average statistic means the error state has to persist for two minutes. A replica that hits an error and is restarted by an automated job inside a minute will not page anyone, while a stopped replica that nobody touches will. Because a broken binlog replica never repairs itself, there is little value in waiting longer; the main reason to extend the window is if you run automation that skips known-harmless errors and want to give it time first.
Missing data deserves a decision too. If the cluster stops being a binlog replica on purpose, the metric disappears; leave missing data as missing so the alarm goes to INSUFFICIENT_DATA rather than firing.
Create the alarm
aws cloudwatch put-metric-alarm \
  --alarm-name aurora-dr-binlog-replication-error \
  --alarm-description "Binlog replication into orders-dr-cluster in error state" \
  --namespace AWS/RDS \
  --metric-name AuroraBinlogReplicaLag \
  --dimensions Name=DBClusterIdentifier,Value=orders-dr-cluster Name=Role,Value=WRITER \
  --statistic Average \
  --period 60 \
  --evaluation-periods 2 \
  --datapoints-to-alarm 2 \
  --threshold -1 \
  --comparison-operator LessThanOrEqualToThreshold \
  --alarm-actions arn:aws:sns:eu-west-2:123456789012:oncall-alerts
When it fires
- Read the error on the writer:
SHOW REPLICA STATUS\G(orSHOW SLAVE STATUS\Gon older versions) and look atLast_SQL_ErrorandLast_IO_Error. - IO errors (cannot connect, binlog not found) point at network, the replication user's password, or binlog retention on the source being too short.
- SQL errors point at data drift. Decide carefully whether to skip the event; Aurora MySQL provides
CALL mysql.rds_skip_repl_error;, but skipping hides drift that may cause the next error. - Restart replication after fixing the cause with
CALL mysql.rds_start_replication;and watch the metric become a non-negative lag. - Prevent writes on the replica by restricting application users to the source.
Questions
Which CloudWatch alarms should I set for RDS?
Start with CPUUtilization, FreeStorageSpace, FreeableMemory, DatabaseConnections and read and write latency per instance, then add engine-specific ones such as ReplicaLag, DBLoad or the Aurora metrics on this site.
Does this alarm detect high replication lag?
No. It fires only on the -1 error value. Create a second alarm with GreaterThanThreshold on the same metric for slow replication.
Broken replication is silent until you need the replica, so this alarm deserves a prompt look. CloudConsole, a phone app for AWS, is built to show alarms like this on your phone with their recent state changes.
Did it start after a deploy? What changed? on the app’s alarm screen lists the deploys and configuration changes from the hour before the alarm fired.
About the app → · Download on the App Store