 CloudConsole
CloudWatch alarm: RDS ReplicaLag
Alarm on AWS/RDS ReplicaLag for the replica's DBInstanceIdentifier with the Maximum over 60 seconds, firing when it is above 60 seconds for 10 consecutive minutes. Lag is how far the read replica trails its source; it is both stale data for readers and data you would lose if you had to promote the replica.
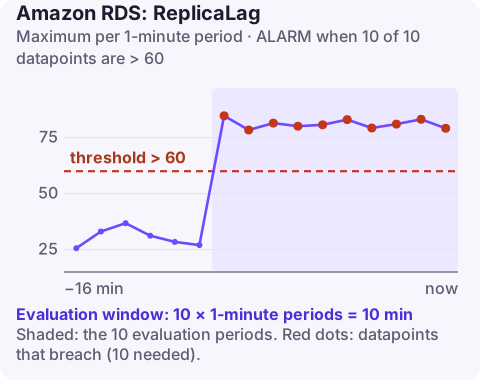
What ReplicaLag measures
For RDS read replicas (MySQL, MariaDB, PostgreSQL and others), ReplicaLag is the delay in seconds between a change on the source and its application on the replica. Create the alarm on the replica, not the source.
Special values matter. 0 means caught up. -1 means replication is not running at all, which this alarm will not catch because -1 is below the threshold. On RDS for PostgreSQL, a replica of a source with no write activity can report lag of up to about five minutes, because there are no new transactions to replay; that is not a real problem.
Real lag is usually caused by a write burst the replica cannot apply as fast (large batch updates, bulk loads), long-running queries on the replica conflicting with replay, a replica on a smaller instance class or with slower storage than the source, or single-threaded apply on MySQL with many concurrent writes on the source.
Recommended alarm settings
| Setting | Recommended value |
|---|---|
| Namespace | AWS/RDS |
| Metric | ReplicaLag |
| Dimensions | DBInstanceIdentifier |
| Statistic | Maximum |
| Threshold | 60.0 |
| Period | 60 seconds |
| Datapoints to alarm | 10 |
| Evaluation periods | 10 |
| Comparison operator | GreaterThanThreshold |
Tuning
- Lower the threshold for replicas that serve user-facing reads where stale data is visible, or that are your disaster recovery copy.
- Raise it for reporting replicas that run long queries and can be minutes behind without harm.
- Catch broken replication too: add an alarm with
LessThanThreshold0 so that -1 notifies you. - Idle PostgreSQL sources: if you see five-minute lag at night, it is the idle effect; a lightweight periodic write on the source removes it.
For cross-Region replicas, network distance adds a baseline lag even on quiet systems; measure it for a while before settling on 60 seconds.
Create the alarm
aws cloudwatch put-metric-alarm \
  --alarm-name rds-orders-replica-lag-60s \
  --alarm-description "orders-db-replica-1 more than 60s behind for 10 minutes" \
  --namespace AWS/RDS \
  --metric-name ReplicaLag \
  --dimensions Name=DBInstanceIdentifier,Value=orders-db-replica-1 \
  --statistic Maximum \
  --period 60 \
  --evaluation-periods 10 \
  --datapoints-to-alarm 10 \
  --threshold 60 \
  --comparison-operator GreaterThanThreshold \
  --alarm-actions arn:aws:sns:eu-west-2:123456789012:oncall-alerts
When it fires
- Check the source's write rate (
WriteIOPS,WriteThroughput) for a burst at the time lag started. - Compare instance sizes with describe-db-instances; an undersized replica cannot keep up with a busy source.
- Look for blocking queries on the replica: long-running reports on PostgreSQL can delay replay; on MySQL check
SHOW REPLICA STATUSfor the SQL thread state. - Relieve and fix: stop the heavy replica query, break large batch writes into smaller transactions, or scale the replica.
Questions
Which CloudWatch alarms should I set for RDS?
A practical baseline is CPUUtilization, FreeStorageSpace, FreeableMemory, DatabaseConnections, ReadLatency and WriteLatency, plus ReplicaLag on replicas. Aurora clusters add metrics such as DBLoad and BufferCacheHitRatio.
What does ReplicaLag -1 mean?
Replication is not active on the replica, for example after an error stopped it. Check the replica's status and events.
Replica lag matters most when you are about to rely on the replica, which is rarely planned. CloudConsole, a phone app for AWS, is built to show the alarm and the lag trend on your phone.
Did it start after a deploy? What changed? on the app’s alarm screen lists the deploys and configuration changes from the hour before the alarm fired.
About the app → · Download on the App Store