 CloudConsole
CloudWatch alarm: Aurora BlockedTransactions
Alarm on AWS/RDS BlockedTransactions per DBInstanceIdentifier with the Average over 60 seconds, firing above your threshold for 5 consecutive minutes. A practical threshold is about 5% of the instance's normal ActiveTransactions; above that, lock contention is holding up a meaningful share of work.
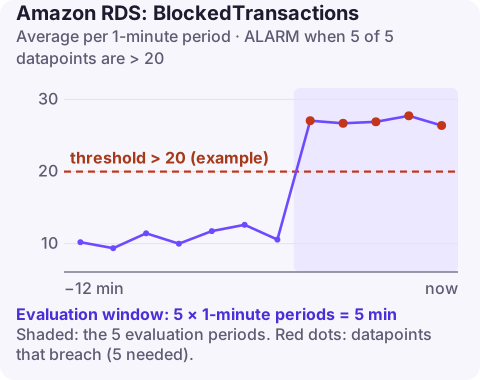
What the metric means
On Aurora MySQL, BlockedTransactions is the rate of transactions that are waiting on a lock held by another transaction. Every blocked transaction eventually either gets its lock and commits, times out, or is rolled back as a deadlock victim. While waiting, it holds its connection and often its own locks, so contention compounds quickly.
What causes it in production: a long-running transaction holding row locks (an admin session left open, a batch job updating many rows in one transaction), hot rows that many transactions update (counters, a single "status" row, sequence tables), sessions idle in a transaction because the application forgot to commit, and large UPDATE or DELETE statements without a selective index, which lock far more rows than intended.
It is worth knowing that a blocked transaction is not necessarily a slow query: a single-row update can wait for minutes behind another session's lock while using no CPU, which is why this metric can catch problems that CPU and latency alarms do not.
Recommended alarm settings
| Setting | Recommended value |
|---|---|
| Namespace | AWS/RDS |
| Metric | BlockedTransactions |
| Dimensions | DBInstanceIdentifier |
| Statistic | Average |
| Threshold | Depends on your situation (about 5% of ActiveTransactions) |
| Period | 60 seconds |
| Datapoints to alarm | 5 |
| Evaluation periods | 5 |
| Comparison operator | GreaterThanThreshold |
Setting the threshold
- Chart
ActiveTransactionsfor the instance over two weeks and take a typical busy-period value, say 400. - 5% of that is 20; use it as the threshold.
- Chart
BlockedTransactionsfor the same period. If it already reaches 20 during normal batch windows, either fix those batches or raise the threshold with a clear note why.
When traffic varies a lot, a metric math alarm on 100 * BlockedTransactions / ActiveTransactions greater than 5 adapts automatically.
Create the alarm
aws cloudwatch put-metric-alarm \
  --alarm-name aurora-orders-writer-blocked-txn \
  --alarm-description "orders writer blocked transactions above 5% of normal active" \
  --namespace AWS/RDS \
  --metric-name BlockedTransactions \
  --dimensions Name=DBInstanceIdentifier,Value=orders-cluster-instance-1 \
  --statistic Average \
  --period 60 \
  --evaluation-periods 5 \
  --datapoints-to-alarm 5 \
  --threshold 20 \
  --comparison-operator GreaterThanThreshold \
  --alarm-actions arn:aws:sns:eu-west-2:123456789012:oncall-alerts
When it fires
- Find the blocker (MySQL 8.0-compatible versions):
Then checkSELECT waiting_pid, waiting_query, blocking_pid, blocking_query, wait_age FROM sys.innodb_lock_waits ORDER BY wait_age DESC;information_schema.innodb_trxfor how long the blocking transaction has been open. - Decide whether to end it. Killing the blocking session rolls back its work, which can itself take time for a large transaction.
- Fix the pattern: commit in smaller batches, add indexes so updates lock only the rows they need, keep transactions short and never wait on user input inside one, and set sensible lock wait timeouts.
- Use Performance Insights to see lock wait events and the SQL involved.
Questions
Which CloudWatch alarms should I set for RDS?
Start with CPUUtilization, FreeStorageSpace, FreeableMemory, DatabaseConnections and read and write latency per instance, then add engine-specific ones such as ReplicaLag, DBLoad or the Aurora metrics on this site.
Is BlockedTransactions the same as deadlocks?
No. Blocked transactions are waiting for a lock; a deadlock is a cycle of waits that InnoDB resolves by rolling one transaction back. Many blocked transactions can occur without any deadlock.
Lock contention can turn a healthy database unresponsive in minutes, and the fix is often a single long transaction. CloudConsole, a phone app for AWS, is built to show the alarm and related metrics on your phone so you can spot it fast.
Did it start after a deploy? What changed? on the app’s alarm screen lists the deploys and configuration changes from the hour before the alarm fired.
About the app → · Download on the App Store