 CloudConsole
CloudWatch alarm: RDS DBLoad
Alarm on AWS/RDS DBLoad per DBInstanceIdentifier using the Average over 60 seconds, firing above your threshold for 15 of 15 minutes. Set the threshold to the instance's vCPU count: DBLoad is the average number of active sessions, and once it stays above the number of CPUs, work is queuing.
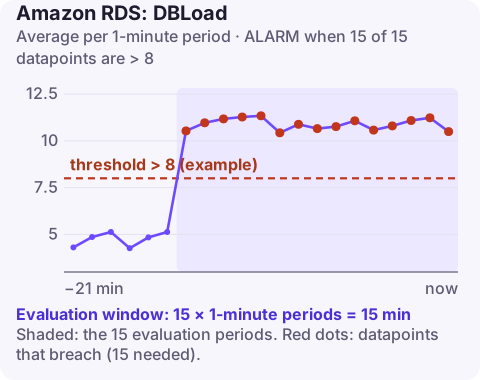
What DBLoad measures
DBLoad comes from Performance Insights, so it is only published when Performance Insights is enabled on the instance. It is the average number of active sessions: sessions either running on CPU or waiting for something (I/O, locks, network, commits). DBLoadCPU and DBLoadNonCPU split it into those two parts.
The vCPU line is the key reference. If load is 6 on an 8-vCPU instance, sessions are mostly getting served. At 20 on the same instance, most sessions are waiting. Because it includes waits, DBLoad can be high while CPU is moderate, for example during lock contention, which is exactly when CPUUtilization alone would miss the problem. It does not apply to serverless instances.
Because it is an average over the period, a single heavy query running for ten seconds barely moves the one-minute value, while many sessions waiting at once move it a lot. That makes it a good signal for contention rather than individual slow statements.
Recommended alarm settings
| Setting | Recommended value |
|---|---|
| Namespace | AWS/RDS |
| Metric | DBLoad |
| Dimensions | DBInstanceIdentifier |
| Statistic | Average |
| Threshold | Depends on your situation (the instance's vCPU count) |
| Period | 60 seconds |
| Datapoints to alarm | 15 |
| Evaluation periods | 15 |
| Comparison operator | GreaterThanThreshold |
Setting the threshold
Look up the vCPU count of the instance class (for example a db.r6g.2xlarge has 8 vCPUs) and use that number. Then check against history:
- If load regularly spikes above vCPUs for a few minutes during batch jobs, the 15-minute window already tolerates that.
- If load sits just under the line all day, you have no headroom; the alarm is right, and the instance needs work or capacity.
- Revisit the threshold whenever you change instance class.
Keep the vCPU number next to the instance class in your infrastructure code, so that a resize and its alarm threshold change in the same commit rather than drifting apart.
Create the alarm
aws cloudwatch put-metric-alarm \
  --alarm-name rds-orders-db-dbload-above-vcpu \
  --alarm-description "orders-db average active sessions above 8 vCPUs for 15 minutes" \
  --namespace AWS/RDS \
  --metric-name DBLoad \
  --dimensions Name=DBInstanceIdentifier,Value=orders-db \
  --statistic Average \
  --period 60 \
  --evaluation-periods 15 \
  --datapoints-to-alarm 15 \
  --threshold 8 \
  --comparison-operator GreaterThanThreshold \
  --alarm-actions arn:aws:sns:eu-west-2:123456789012:oncall-alerts
When it fires
- Open Performance Insights and slice load by wait event. That single view tells you which kind of problem you have.
- Mostly CPU: find the top SQL by CPU and tune it; also see the CPU alarm runbook.
- Mostly I/O waits: check read and write latency and IOPS limits; missing indexes causing scans are common.
- Mostly lock waits: find blocking sessions and long transactions; on Aurora MySQL see BlockedTransactions.
- Short term: throttle or pause the heaviest client, cap connection pool sizes; long term, tune, scale, or offload reads.
Questions
How do I create a CloudWatch alarm for RDS CPU utilization?
Alarm on AWS/RDS CPUUtilization with the DBInstanceIdentifier dimension, Average over 60 seconds, above 90% for 5 of 5 periods.
Which CloudWatch alarms should I set for RDS?
Start with CPUUtilization, FreeStorageSpace, FreeableMemory, DatabaseConnections and read and write latency per instance, then add engine-specific ones such as ReplicaLag, DBLoad or the Aurora metrics on this site.
Why is the DBLoad metric missing from CloudWatch?
DBLoad is published only when Performance Insights is enabled on the DB instance. Enable it and the metric appears in the AWS/RDS namespace.
DBLoad tells you whether the database is the bottleneck, which is often the first question in an incident. CloudConsole, a phone app for AWS, is built to show the alarm and recent metrics on your phone while you decide what to do.
Did it start after a deploy? What changed? on the app’s alarm screen lists the deploys and configuration changes from the hour before the alarm fired.
About the app → · Download on the App Store