 CloudConsole
CloudWatch alarm: Aurora BufferCacheHitRatio
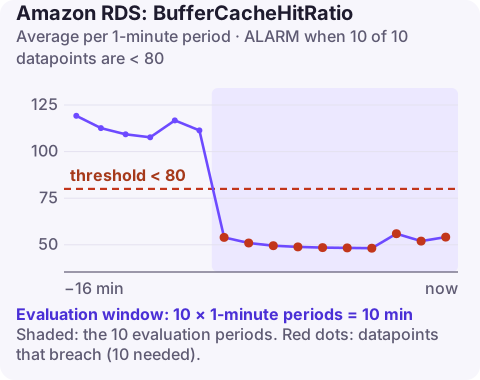
Alarm on AWS/RDS BufferCacheHitRatio per DBInstanceIdentifier with the Average over 60 seconds, firing when it is below 80% for 10 of 10 minutes. A sustained low hit ratio means a large share of reads are going to the storage layer instead of memory, which raises latency and I/O cost.
What the metric measures
BufferCacheHitRatio is the percentage of data page requests served from the instance's buffer cache. Well-sized Aurora instances running OLTP workloads typically sit in the high nineties, because the working set fits in memory. When it falls, queries are reading pages that are not cached, and each one costs a trip to the cluster volume.
The usual reasons: the working set has grown past the instance's memory, a new query or report scans a large table that was never cached, a plan change switched an index lookup to a full scan, or the instance was recently restarted or failed over and the cache is still warming. On a reader, being sent different traffic than the writer (analytical queries) produces a lower ratio by nature.
The ratio is computed per instance, so the writer and each reader in a cluster can have very different values. Alarm on the instances that serve latency-sensitive traffic, and do not be surprised if an analytics reader never reaches the writer's numbers.
Recommended alarm settings
| Setting | Recommended value |
|---|---|
| Namespace | AWS/RDS |
| Metric | BufferCacheHitRatio |
| Dimensions | DBInstanceIdentifier |
| Statistic | Average |
| Threshold | 80.0 |
| Period | 60 seconds |
| Datapoints to alarm | 10 |
| Evaluation periods | 10 |
| Comparison operator | LessThanThreshold |
Tuning
- Ten minutes below 80% skips cache warm-up after short events but will fire after a failover or restart until the cache refills. If that is noisy, accept it, or suppress the alarm briefly after planned maintenance.
- For analytics-focused readers, set a lower threshold based on two weeks of history; scans naturally miss the cache.
- For latency-critical writers that normally run at 99%, a higher threshold such as 95% catches regressions earlier.
Avoid reading too much into a single instance's number in isolation; compare it with read latency and IOPS to decide whether misses are actually hurting.
Create the alarm
aws cloudwatch put-metric-alarm \
  --alarm-name aurora-orders-writer-cache-hit-low \
  --alarm-description "orders writer buffer cache hit ratio below 80% for 10 minutes" \
  --namespace AWS/RDS \
  --metric-name BufferCacheHitRatio \
  --dimensions Name=DBInstanceIdentifier,Value=orders-cluster-instance-1 \
  --statistic Average \
  --period 60 \
  --evaluation-periods 10 \
  --datapoints-to-alarm 10 \
  --threshold 80 \
  --comparison-operator LessThanThreshold \
  --alarm-actions arn:aws:sns:eu-west-2:123456789012:oncall-alerts
When it fires
- Rule out a restart: check EngineUptime and RDS events for a recent reboot or failover.
- Find the reads: Performance Insights top SQL by I/O wait events; look for new queries or changed plans, and add indexes where scans can be avoided.
- Check memory: FreeableMemory and the buffer pool size. If the working set has outgrown the instance, scale up the class.
- Move scans elsewhere: run reports on a dedicated reader so they do not evict hot pages on the instance serving users.
Questions
Which CloudWatch alarms should I set for RDS?
Start with CPUUtilization, FreeStorageSpace, FreeableMemory, DatabaseConnections and read and write latency per instance, then add engine-specific ones such as ReplicaLag, DBLoad or the Aurora metrics on this site.
What is a good Aurora buffer cache hit ratio?
For transactional workloads, typically above 99%. Analytical workloads that scan large tables run lower without necessarily being unhealthy.
A falling cache hit ratio is often the early sign of a slower database, well before users complain. CloudConsole, a phone app for AWS, is built to show this alarm with the latency metrics beside it on your phone.
Did it start after a deploy? What changed? on the app’s alarm screen lists the deploys and configuration changes from the hour before the alarm fired.
About the app → · Download on the App Store