 CloudConsole
CloudWatch alarm: RDS ReadLatency
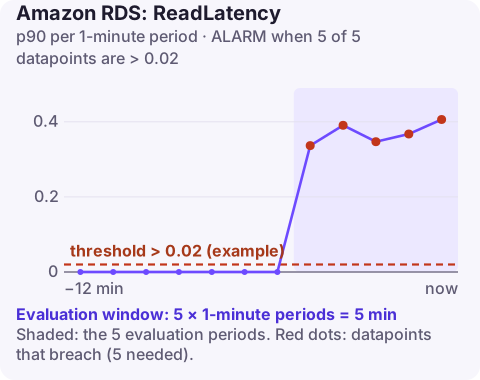
Alarm on AWS/RDS ReadLatency per DBInstanceIdentifier using the p90 extended statistic over 60 seconds, firing above your threshold for 5 consecutive minutes. Around 20 milliseconds is a reasonable starting point for most storage types; the metric is reported in seconds, so enter it as 0.02.
What ReadLatency measures
ReadLatency is the average time each disk read I/O takes at the storage layer. It is not query latency: a slow query from a bad plan can run entirely from memory and never move this metric. A rise here means the storage itself is taking longer to serve reads.
On RDS with EBS storage the usual reasons are reaching the volume's IOPS or throughput limit, gp2 volumes exhausting their burst balance, or the instance class's own EBS bandwidth being the bottleneck. A drop in buffer cache effectiveness, so that more reads go to disk at all, often comes first. On Aurora, high read latency usually reflects I/O volume and cache misses.
Graph it together with ReadIOPS. Latency that rises with IOPS points at a capacity limit; latency that rises while IOPS stays flat points at something else on the storage path, which is worth raising with AWS Support if it persists.
Recommended alarm settings
| Setting | Recommended value |
|---|---|
| Namespace | AWS/RDS |
| Metric | ReadLatency |
| Dimensions | DBInstanceIdentifier |
| Statistic | p90 |
| Threshold | Depends on your situation (about 0.02 seconds is a common start) |
| Period | 60 seconds |
| Datapoints to alarm | 5 |
| Evaluation periods | 5 |
| Comparison operator | GreaterThanThreshold |
Choosing the threshold
- Units: seconds. 20 ms =
0.02; 5 ms =0.005. Entering 20 creates an alarm that never fires. - Baseline from history: chart p90 for two weeks; SSD-backed storage often sits in low single-digit milliseconds. Put the threshold well above normal peaks.
- Latency-sensitive apps can use a lower value; analytics workloads that scan a lot can tolerate more.
- p90 needs a reasonable number of samples per minute; on very idle instances it can jump around, which the 5-of-5 window helps absorb.
Create the alarm
aws cloudwatch put-metric-alarm \
  --alarm-name rds-orders-db-read-latency-p90 \
  --alarm-description "orders-db p90 read latency above 20 ms for 5 minutes" \
  --namespace AWS/RDS \
  --metric-name ReadLatency \
  --dimensions Name=DBInstanceIdentifier,Value=orders-db \
  --extended-statistic p90 \
  --period 60 \
  --evaluation-periods 5 \
  --datapoints-to-alarm 5 \
  --threshold 0.02 \
  --comparison-operator GreaterThanThreshold \
  --alarm-actions arn:aws:sns:eu-west-2:123456789012:oncall-alerts
When it fires
- Compare with the limits: graph
ReadIOPSandReadThroughput(plus the write equivalents) against the provisioned IOPS and throughput of the volume. Flat at a ceiling means you are I/O bound. - Check burst balance on gp2 volumes; when it reaches zero, latency jumps.
- Look at what is reading: Performance Insights shows I/O wait events and the SQL behind them. Full table scans from a missing index are a frequent trigger.
- Fix: add indexes, increase memory so more data is cached, raise provisioned IOPS or move to gp3 with higher limits, or for Aurora consider the I/O-Optimized storage configuration if I/O is heavy.
Questions
Which CloudWatch alarms should I set for RDS?
A practical baseline is CPUUtilization, FreeStorageSpace, FreeableMemory, DatabaseConnections, ReadLatency and WriteLatency, plus ReplicaLag on replicas. Aurora clusters add metrics such as DBLoad and BufferCacheHitRatio.
What is a good RDS read latency?
Single-digit milliseconds is typical on SSD storage. Sustained values above about 20 ms usually deserve a look.
Storage latency alarms often explain slow application pages, so it helps to see them next to each other. CloudConsole, a phone app for AWS, is built to show your RDS alarms with their recent metric history on a phone screen.
Did it start after a deploy? What changed? on the app’s alarm screen lists the deploys and configuration changes from the hour before the alarm fired.
About the app → · Download on the App Store