 CloudConsole
CloudWatch alarm: Aurora FreeLocalStorage
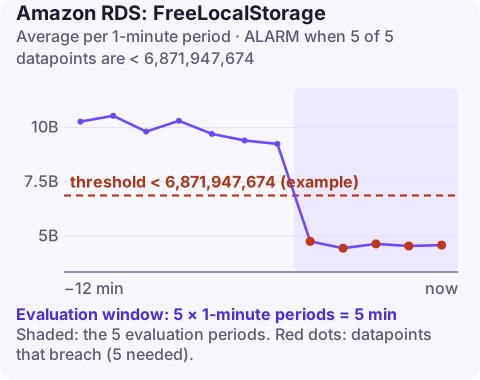
Alarm on AWS/RDS FreeLocalStorage per DBInstanceIdentifier with the Average over 60 seconds, firing when it drops below your threshold for 5 of 5 minutes. Set the threshold to roughly 10–20% of the instance's local storage. Unlike the shared cluster volume, local storage is fixed by instance class, and running out fails queries that need temporary space.
What local storage is used for
Aurora keeps your data on the distributed cluster volume, but each DB instance also has its own local disk for non-persistent files. On Aurora PostgreSQL that means error logs and temporary files from sorts, hash joins and index builds that do not fit in memory. On Aurora MySQL it means error, general, slow query and audit logs, plus temporary tables that are not InnoDB.
The size of this disk depends on the instance class and cannot be grown separately. The only way to get more is a larger class. The alarm applies to provisioned instances; Aurora Serverless v2 handles this differently.
Production causes, most common first: one large analytical query spilling gigabytes of temp files, verbose logging (general log or log_statement = all) left on after debugging, audit logging, and big ALTER TABLE or index operations.
Recommended alarm settings
| Setting | Recommended value |
|---|---|
| Namespace | AWS/RDS |
| Metric | FreeLocalStorage |
| Dimensions | DBInstanceIdentifier |
| Statistic | Average |
| Threshold | Depends on your situation (about 10–20% of local storage, in bytes) |
| Period | 60 seconds |
| Datapoints to alarm | 5 |
| Evaluation periods | 5 |
| Comparison operator | LessThanThreshold |
Setting the threshold
Look up the local storage size for your instance class in the Aurora documentation, then take 10–20% depending on how fast usage can change. If the instance class provides 64 GiB, 10% is about 6.9 billion bytes and 20% about 13.7 billion. Lean towards 20% if a single query can write tens of gigabytes of temp data quickly, which is common with reporting workloads.
Check history too: a sawtooth pattern of temp files filling and freeing is normal; a floor that keeps falling means logs are accumulating.
Create the alarm
aws cloudwatch put-metric-alarm \
  --alarm-name aurora-reporting-1-local-storage-low \
  --alarm-description "Local storage on reporting-cluster-instance-1 below 10%" \
  --namespace AWS/RDS \
  --metric-name FreeLocalStorage \
  --dimensions Name=DBInstanceIdentifier,Value=reporting-cluster-instance-1 \
  --statistic Average \
  --period 60 \
  --evaluation-periods 5 \
  --datapoints-to-alarm 5 \
  --threshold 6871947674 \
  --comparison-operator LessThanThreshold \
  --alarm-actions arn:aws:sns:eu-west-2:123456789012:oncall-alerts
When it fires
- Find active temp-heavy queries. On PostgreSQL,
pg_stat_activityshows running queries andpg_stat_database.temp_bytesshows how much temp data each database has written; on MySQL check the processlist for long sorts andALTERstatements. - Check log settings in the parameter group and turn off anything left verbose. List log sizes with describe-db-log-files.
- Reduce spills: on PostgreSQL, a larger
work_memfor the specific reporting role (not globally) keeps more sorts in memory; add indexes that avoid big sorts. - Isolate heavy queries on a dedicated reader, or scale the instance class for more local storage.
Questions
Which CloudWatch alarms should I set for RDS?
A practical baseline is CPUUtilization, FreeStorageSpace, FreeableMemory, DatabaseConnections, ReadLatency and WriteLatency, plus ReplicaLag on replicas. Aurora clusters add metrics such as DBLoad and BufferCacheHitRatio.
What happens when Aurora local storage is full?
Operations that need temporary space or log writes fail; on Aurora PostgreSQL that typically surfaces as an error that the server could not write to a temporary file.
Local storage can go from comfortable to full during a single bad query, so the timing of the alarm matters. CloudConsole, a phone app for AWS, is built to show this kind of alarm with its recent history on your phone.
Did it start after a deploy? What changed? on the app’s alarm screen lists the deploys and configuration changes from the hour before the alarm fired.
About the app → · Download on the App Store