 CloudConsole
CloudWatch alarm: RDS WriteLatency
Alarm on AWS/RDS WriteLatency per DBInstanceIdentifier with the p90 extended statistic over 60 seconds, firing above your threshold for 5 of 5 minutes. Writes slower than about 20 ms usually deserve investigation; enter that as 0.02, because the metric is measured in seconds.
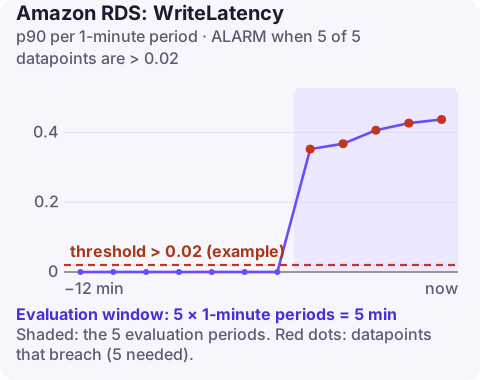
What WriteLatency measures
WriteLatency is the average time each write I/O to storage takes. Commits are where users feel it most: a transaction cannot complete until its log write is durable, so slow write I/O turns directly into slow inserts, updates and commits, and then into connection pile-ups as transactions take longer.
Write latency has a few causes that read latency does not. On Multi-AZ instance deployments, writes are synchronously replicated to the standby, which adds latency compared with a Single-AZ instance. Checkpoints and log flushes produce periodic write bursts. Large bulk loads or index rebuilds saturate write throughput. And the same EBS limits apply: provisioned IOPS, throughput, gp2 burst balance and instance EBS bandwidth.
Separately, watch DiskQueueDepth: a queue that keeps growing means requests arrive faster than storage completes them, and latency follows. Seeing queue depth rise first often gives you a few minutes' notice.
Recommended alarm settings
| Setting | Recommended value |
|---|---|
| Namespace | AWS/RDS |
| Metric | WriteLatency |
| Dimensions | DBInstanceIdentifier |
| Statistic | p90 |
| Threshold | Depends on your situation (roughly 0.02 seconds as a start) |
| Period | 60 seconds |
| Datapoints to alarm | 5 |
| Evaluation periods | 5 |
| Comparison operator | GreaterThanThreshold |
Tuning the threshold
- Chart p90 for two weeks. A Multi-AZ instance will have a higher normal floor than a Single-AZ one; set the threshold from what you observe, not from a generic number.
- If checkpoint bursts cause regular short spikes, the 5-minute window usually absorbs them. If not, look at checkpoint settings rather than raising the threshold.
- For write-heavy OLTP systems where commit time is critical, a lower threshold (10 ms) gives earlier warning.
Re-baseline after storage changes such as moving from gp2 to gp3 or changing provisioned IOPS, because the normal floor shifts.
Create the alarm
aws cloudwatch put-metric-alarm \
  --alarm-name rds-orders-db-write-latency-p90 \
  --alarm-description "orders-db p90 write latency above 20 ms for 5 minutes" \
  --namespace AWS/RDS \
  --metric-name WriteLatency \
  --dimensions Name=DBInstanceIdentifier,Value=orders-db \
  --extended-statistic p90 \
  --period 60 \
  --evaluation-periods 5 \
  --datapoints-to-alarm 5 \
  --threshold 0.02 \
  --comparison-operator GreaterThanThreshold \
  --alarm-actions arn:aws:sns:eu-west-2:123456789012:oncall-alerts
When it fires
- Check I/O against limits:
WriteIOPSandWriteThroughputagainst provisioned values,BurstBalanceon gp2, andDiskQueueDepth; a rising queue depth confirms storage is the bottleneck. - Find the writers: Performance Insights shows write-related wait events and the statements behind them. Bulk jobs and migrations are usual suspects.
- Spread or shrink writes: batch small transactions into fewer commits, throttle bulk loads, schedule index rebuilds off-peak.
- Add capacity: more provisioned IOPS or throughput, gp3 instead of gp2, or a larger instance class with more EBS bandwidth. Aurora's I/O-Optimized configuration targets I/O-heavy clusters on cost rather than latency, so weigh it accordingly.
Questions
Which CloudWatch alarms should I set for RDS?
Start with CPUUtilization, FreeStorageSpace, FreeableMemory, DatabaseConnections and read and write latency per instance, then add engine-specific ones such as ReplicaLag, DBLoad or the Aurora metrics on this site.
Why is write latency higher on Multi-AZ RDS?
Writes on a Multi-AZ instance deployment are committed synchronously to a standby in another Availability Zone, which adds some latency to each write.
What unit is RDS WriteLatency?
Seconds. 20 milliseconds is 0.02 in the alarm threshold.
Slow commits ripple outwards into every service using the database, so it is worth seeing the storage alarm early. CloudConsole, a phone app for AWS, is built to show RDS alarms and their metric history on your phone.
Did it start after a deploy? What changed? on the app’s alarm screen lists the deploys and configuration changes from the hour before the alarm fired.
About the app → · Download on the App Store