 CloudConsole
aws cloudwatch get-metric-statistics
aws cloudwatch get-metric-statistics --namespace AWS/EC2 --metric-name CPUUtilization --dimensions Name=InstanceId,Value=i-0123456789abcdef0 --start-time 2026-11-16T00:00:00Z --end-time 2026-11-16T06:00:00Z --period 300 --statistics Average Maximum returns one metric's values over a time range. Datapoints come back unsorted, so sort them in --query, and a call can return at most 1,440 datapoints.
What the command does
This is the simplest way to read a single metric. You name the metric with its namespace, metric name and exact dimensions, pick a time range, a period and one or more statistics (or percentiles with --extended-statistics), and get back Datapoints[], each with a Timestamp, the requested statistics and a Unit.
For several metrics at once, metric math, or more than 1,440 points, use get-metric-data instead.
Syntax
aws cloudwatch get-metric-statistics \
  --namespace AWS/EC2 --metric-name CPUUtilization \
  --dimensions Name=InstanceId,Value=i-0123456789abcdef0 \
  --start-time 2026-11-16T00:00:00Z --end-time 2026-11-16T06:00:00Z \
  --period 300 \
  --statistics Average Maximum   (or --extended-statistics p99)
Worked examples
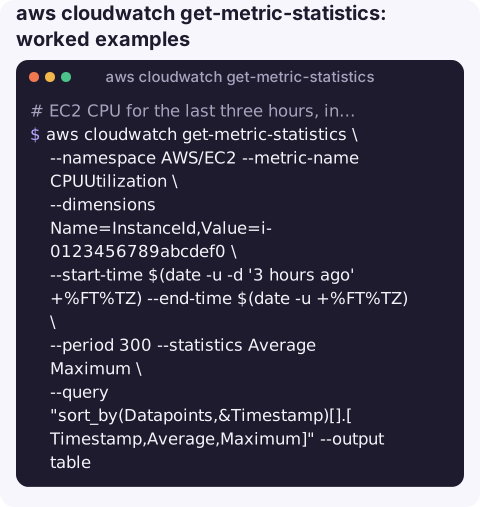
EC2 CPU for the last three hours, in time order (GNU date):
aws cloudwatch get-metric-statistics \
  --namespace AWS/EC2 --metric-name CPUUtilization \
  --dimensions Name=InstanceId,Value=i-0123456789abcdef0 \
  --start-time $(date -u -d '3 hours ago' +%FT%TZ) --end-time $(date -u +%FT%TZ) \
  --period 300 --statistics Average Maximum \
  --query "sort_by(Datapoints,&Timestamp)[].[Timestamp,Average,Maximum]" --output table
Lambda p99 duration per hour over a day:
aws cloudwatch get-metric-statistics \
  --namespace AWS/Lambda --metric-name Duration \
  --dimensions Name=FunctionName,Value=checkout \
  --start-time $(date -u -d '1 day ago' +%FT%TZ) --end-time $(date -u +%FT%TZ) \
  --period 3600 --extended-statistics p99 \
  --query "sort_by(Datapoints,&Timestamp)[].[Timestamp,ExtendedStatistics.p99]" --output text
Total requests to a load balancer yesterday as a single number:
aws cloudwatch get-metric-statistics \
  --namespace AWS/ApplicationELB --metric-name RequestCount \
  --dimensions Name=LoadBalancer,Value=app/prod-alb/0123456789abcdef \
  --start-time 2026-11-15T00:00:00Z --end-time 2026-11-16T00:00:00Z \
  --period 86400 --statistics Sum --query "Datapoints[0].Sum"
S3 bucket size (a daily storage metric, so use a day-long period):
aws cloudwatch get-metric-statistics --namespace AWS/S3 --metric-name BucketSizeBytes \
  --dimensions Name=BucketName,Value=my-bucket Name=StorageType,Value=StandardStorage \
  --start-time $(date -u -d '2 days ago' +%FT%TZ) --end-time $(date -u +%FT%TZ) \
  --period 86400 --statistics Average
Retention and period rules
| Data age | Smallest period available |
|---|---|
| Up to 3 hours (high-resolution metrics) | 1 second |
| Up to 15 days | 60 seconds |
| 15 to 63 days | 5 minutes |
| 63 to 455 days | 1 hour |
Asking for a finer period than the data's age allows returns empty or partial results.
Gotchas
- Datapoints are not sorted. Always use
sort_by(Datapoints,&Timestamp). - 1,440 datapoint limit. Range divided by period must not exceed it; raise the period or split the range.
- All dimensions, exactly. If the metric is published with two dimensions, passing one returns nothing. Check combinations with
list-metrics. - Empty means no data, not zero. Many AWS metrics, such as Lambda
Errors, are only published when there is activity. - Times are UTC. Use the
Zsuffix or an explicit offset to avoid off-by-hours surprises.
Questions
What is the difference between get-metric-statistics and get-metric-data?
get-metric-statistics reads one metric with simple statistics. get-metric-data reads up to hundreds of metrics per call, supports metric math and search expressions, and paginates large results.
Why does get-metric-statistics return no datapoints?
Usually the dimensions do not match exactly, the time range has no activity, or the period is finer than the data's retention allows.
How do I get CloudWatch log events instead of metrics?
Logs are a separate service: use aws logs filter-log-events or aws logs tail.
A quick look at a metric's recent shape often tells you whether an alarm is real. CloudConsole, a phone app for AWS, is built to show the metric behind each alarm on a phone.
About the app → · Download on the App Store