 CloudConsole
CloudWatch alarm: Aurora StorageNetworkThroughput
Alarm on AWS/RDS StorageNetworkThroughput for DBClusterIdentifier with Role=WRITER, Average over 60 seconds, firing above your threshold for 5 of 5 minutes. Set the threshold to about 80–90% of the writer instance class's network bandwidth, converted to bytes per second, because storage traffic competes for that same network link.
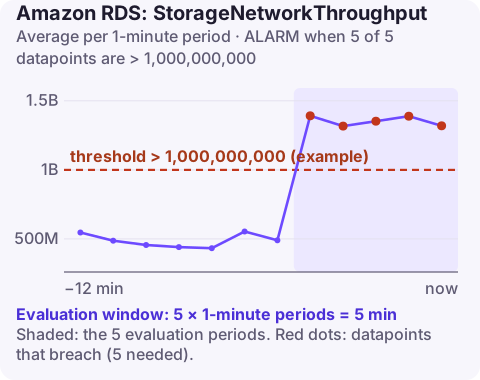
What the metric measures
Aurora instances do not have local data disks; every page read from and written to the cluster volume crosses the network. StorageNetworkThroughput is that storage traffic, in bytes per second. When it approaches the instance's network capacity, storage requests queue behind each other, and read and write latency go up even though the storage layer itself is fine.
What drives it: large scans that miss the buffer cache, bulk loads and big batch updates, index builds, and write-heavy workloads generating lots of log traffic. Client traffic (result sets going to applications) shares the instance's network too, so large result sets add pressure.
Recommended alarm settings
| Setting | Recommended value |
|---|---|
| Namespace | AWS/RDS |
| Metric | StorageNetworkThroughput |
| Dimensions | DBClusterIdentifier, Role=WRITER |
| Statistic | Average |
| Threshold | Depends on your situation (80–90% of instance bandwidth, in bytes/second) |
| Period | 60 seconds |
| Datapoints to alarm | 5 |
| Evaluation periods | 5 |
| Comparison operator | GreaterThanThreshold |
Computing the threshold
- Find the network bandwidth of the writer's instance class (published in Gbps in the instance type specifications). Smaller classes often list an "up to" figure that is a burst; use the baseline where one is given.
- Convert: 10 Gbps = 1,250,000,000 bytes per second.
- Take 80%: 1,000,000,000 bytes per second.
- Compare with history. If peaks are already near that line, the alarm is right to fire; the instance is close to network bound.
Update the threshold when you change instance class, and remember a failover can make a different-sized instance the writer if your instances are not all the same class.
Before alarming on every instance, check which are actually at risk: writers on large instance classes rarely come near their network limit. Prioritise smaller classes running bulk loads or reporting, where storage traffic can reach the line quickly.
Create the alarm
aws cloudwatch put-metric-alarm \
  --alarm-name aurora-orders-writer-storage-network \
  --alarm-description "orders writer storage network above 80% of 10 Gbps" \
  --namespace AWS/RDS \
  --metric-name StorageNetworkThroughput \
  --dimensions Name=DBClusterIdentifier,Value=orders-cluster Name=Role,Value=WRITER \
  --statistic Average \
  --period 60 \
  --evaluation-periods 5 \
  --datapoints-to-alarm 5 \
  --threshold 1000000000 \
  --comparison-operator GreaterThanThreshold \
  --alarm-actions arn:aws:sns:eu-west-2:123456789012:oncall-alerts
When it fires
- Check latency: look at ReadLatency and WriteLatency for the same window; if they have not moved, there is still some headroom.
- Identify the workload: Performance Insights top SQL during the alarm; bulk jobs and full scans are the common cause.
- Reduce traffic: add indexes so fewer pages are read, move reports to a reader, and schedule bulk loads away from peak.
- Scale: if the pattern is normal business load, move to an instance class with more network bandwidth.
Questions
Which CloudWatch alarms should I set for RDS?
Start with CPUUtilization, FreeStorageSpace, FreeableMemory, DatabaseConnections and read and write latency per instance, then add engine-specific ones such as ReplicaLag, DBLoad or the Aurora metrics on this site.
Why does Aurora storage traffic use network bandwidth?
Aurora separates compute from storage: the cluster volume is a distributed service reached over the network, so every page read or write uses the instance's network capacity.
Network-bound databases look like slow storage from the application, which makes the cause hard to spot on a small screen. CloudConsole, a phone app for AWS, is built to show this alarm next to the latency metrics on your phone.
Did it start after a deploy? What changed? on the app’s alarm screen lists the deploys and configuration changes from the hour before the alarm fired.
About the app → · Download on the App Store